

A polished Santa Monica listing can look perfect, but is it really priced right? In today’s Santa Monica real estate market, shiny staging and curb appeal don’t tell the whole story. You need to know how to read data like price per square foot, days on market, and list-to-sale price ratios. Let’s break down the signals that reveal true value, so you don’t overpay or leave money on the table. For more insights, check our First-Time Home Buyer Guide for Santa Monica.
Evaluating Santa Monica Listings
Santa Monica’s real estate can dazzle with its allure, but does the price reflect its true worth? Understanding the nuances of home pricing here is crucial.
Understanding Santa Monica Home Prices
Home prices in Santa Monica can vary greatly, influenced by location, amenities, and market trends. Buyers and sellers need to grasp these elements to make informed decisions. The average price for homes may seem high, but it’s essential to consider what you’re getting for that price. Are you close to the beach? Is the home updated with modern features? Remember, a higher price might mean fewer repairs in the future. For more detailed market insights, check out Realtor.com’s market analysis.
Assessing Price Per Square Foot
Price per square foot is a crucial metric in evaluating a property’s value. It helps compare homes of different sizes. A higher price per square foot often indicates a desirable location or superior condition. However, don’t rely solely on this number. Consider the home’s layout and usability. For instance, a well-designed smaller home might offer better use of space than a larger, poorly configured one.
Comparative Market Analysis Insights
A comparative market analysis (CMA) offers in-depth insights into how a property compares to others recently sold in the area. This analysis considers factors like size, condition, and location. It can reveal if a listing is competitively priced. Working with an expert who can provide a detailed CMA ensures you have all the data you need to make smart decisions.
Key Pricing Indicators
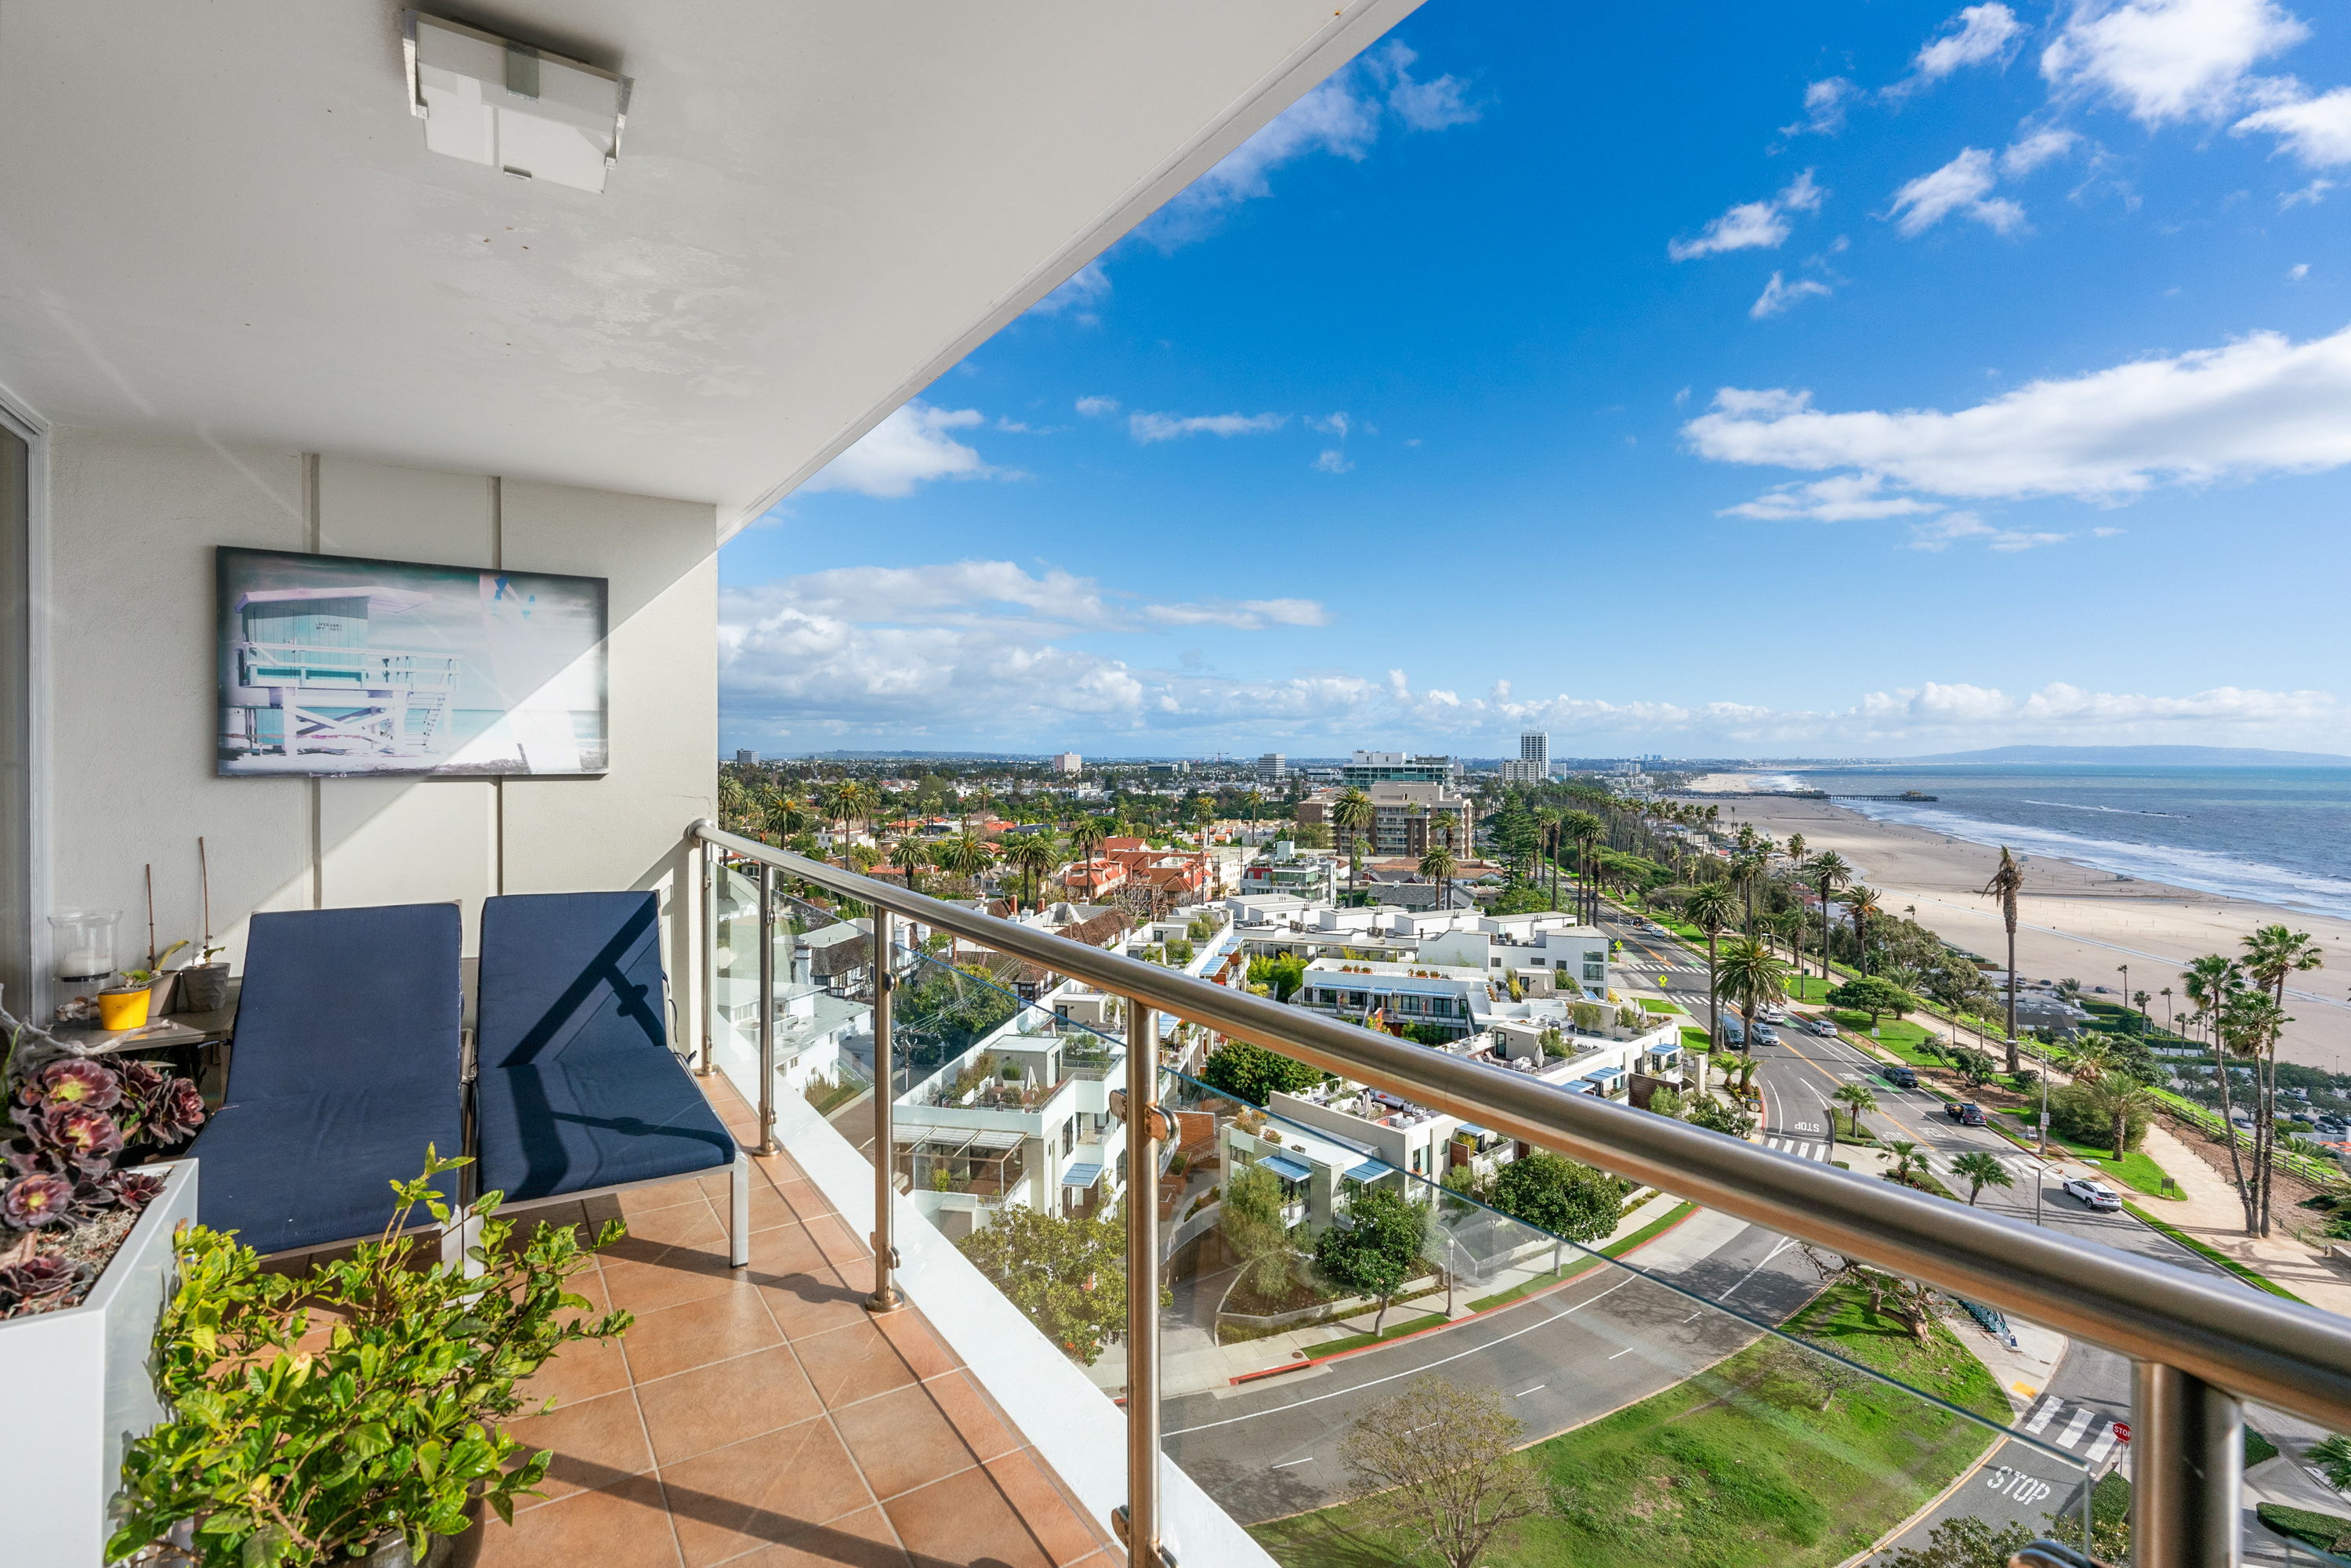
Understanding the key indicators of a property’s market value can save you time and money. Let’s dive into these crucial signals.
Interpreting Days on Market Data
Days on market (DOM) data tells you how long a property has been listed for sale. A longer DOM might indicate a higher-than-market price or less desirable features, while a shorter DOM often signifies a well-priced or highly sought-after home. If a property lingers on the market, it could be an opportunity to negotiate a better deal.
List-to-Sale Price Ratio Analysis
The list-to-sale price ratio shows the difference between the asking price and the actual sale price. A ratio close to 100% means homes are selling for their asking price, indicating a strong market. If the ratio is lower, there might be room for negotiation. Buyers should keep an eye on this metric to identify potential bargains.
Months of Inventory Insights
Months of inventory measures how long it would take to sell all available homes at the current pace. A lower number indicates a seller’s market, with high demand and limited supply. Conversely, a higher number suggests a buyer’s market, where more negotiation might be possible. Understanding these dynamics can guide your buying or selling strategy.
Strategies for Buyers and Sellers

In today’s fast-paced market, having a strategic approach is vital for success. Here are some key tactics for both buyers and sellers.
Pricing Strategy for Sellers
Setting the right price is crucial for sellers. Start by studying comparable homes and their sale prices. If priced too high, your home might sit unsold, resulting in price reductions. Conversely, a competitive price can generate multiple offers quickly. Engage with a knowledgeable real estate agent to craft a pricing strategy that attracts serious buyers.
Navigating Bidding Wars
In a competitive market, bidding wars can arise. Buyers should set a clear budget and stick to it to avoid overspending. Sellers can benefit from bidding wars by highlighting their property’s unique features and creating urgency. Manage offers efficiently to maximize your home’s selling price without alienating potential buyers.
Off-Market Opportunities and Price Reductions
Off-market listings can be a goldmine for buyers looking for less competition. These properties often offer price reductions and unique opportunities. Sellers might consider off-market sales for privacy or to avoid market fluctuations. Always weigh the pros and cons of off-market transactions to ensure they align with your goals.
Frequently Asked Questions
What is a comparative market analysis (CMA)?
A CMA is a detailed report comparing a property to similar homes recently sold in the area. It helps determine a fair market price by considering factors like size, condition, and location.
How does price per square foot impact home value?
Price per square foot is a metric used to compare the value of homes of different sizes. A higher price per square foot often indicates a more desirable location or superior condition.
What does the list-to-sale price ratio tell me?
This ratio compares a home’s asking price to its final sale price. A higher ratio suggests homes are selling near their asking price, indicating a strong market.