

A property’s rent can look impressive and still leave too little to cover expenses and debt. To learn how to analyze a real estate deal, estimate income after vacancy, subtract operating costs to find net operating income, then compare that figure with the purchase price and debt payments. These calculations help show how the property may perform before you commit.
It’s natural to focus first on rent and the asking price, but those figures alone don’t reveal the full picture. Vacancy, maintenance, taxes, insurance, financing terms, and the cash you invest all affect potential returns.
This article explains how to build a realistic income estimate, account for vacancy, and calculate cash flow, cap rate, cash-on-cash return, and debt coverage. You’ll see what each measure tells you and how to use them together to compare a property’s income potential with its costs, financing, and your investment goals.
Key Takeaways
- Estimate rent from market conditions, then account for vacancy before treating projected income as dependable.
- Subtract operating expenses from effective rental income to find net operating income, keeping debt payments separate.
- Use cap rate to compare a property’s income with its price, and cash-on-cash return to assess cash flow against the cash invested.
- Compare net operating income with debt service to understand how comfortably the property’s income covers its loan payments.
- Consider financing, property condition, local market factors, and your goals together before judging a deal’s potential.
Cash-on-cash return
Cash-on-cash return compares annual rental cash flow with the cash invested. Calculate it after operating expenses and debt service so the result reflects both financing and property performance.
For example, $1,000 in annual positive cash flow on a $20,000 initial investment represents a 5% return. Mortgage principal reduction can add to an investor’s overall return, but it isn’t rental cash flow.
Watch this overview to see how the numbers fit together:
Financing Costs and Mortgage Terms
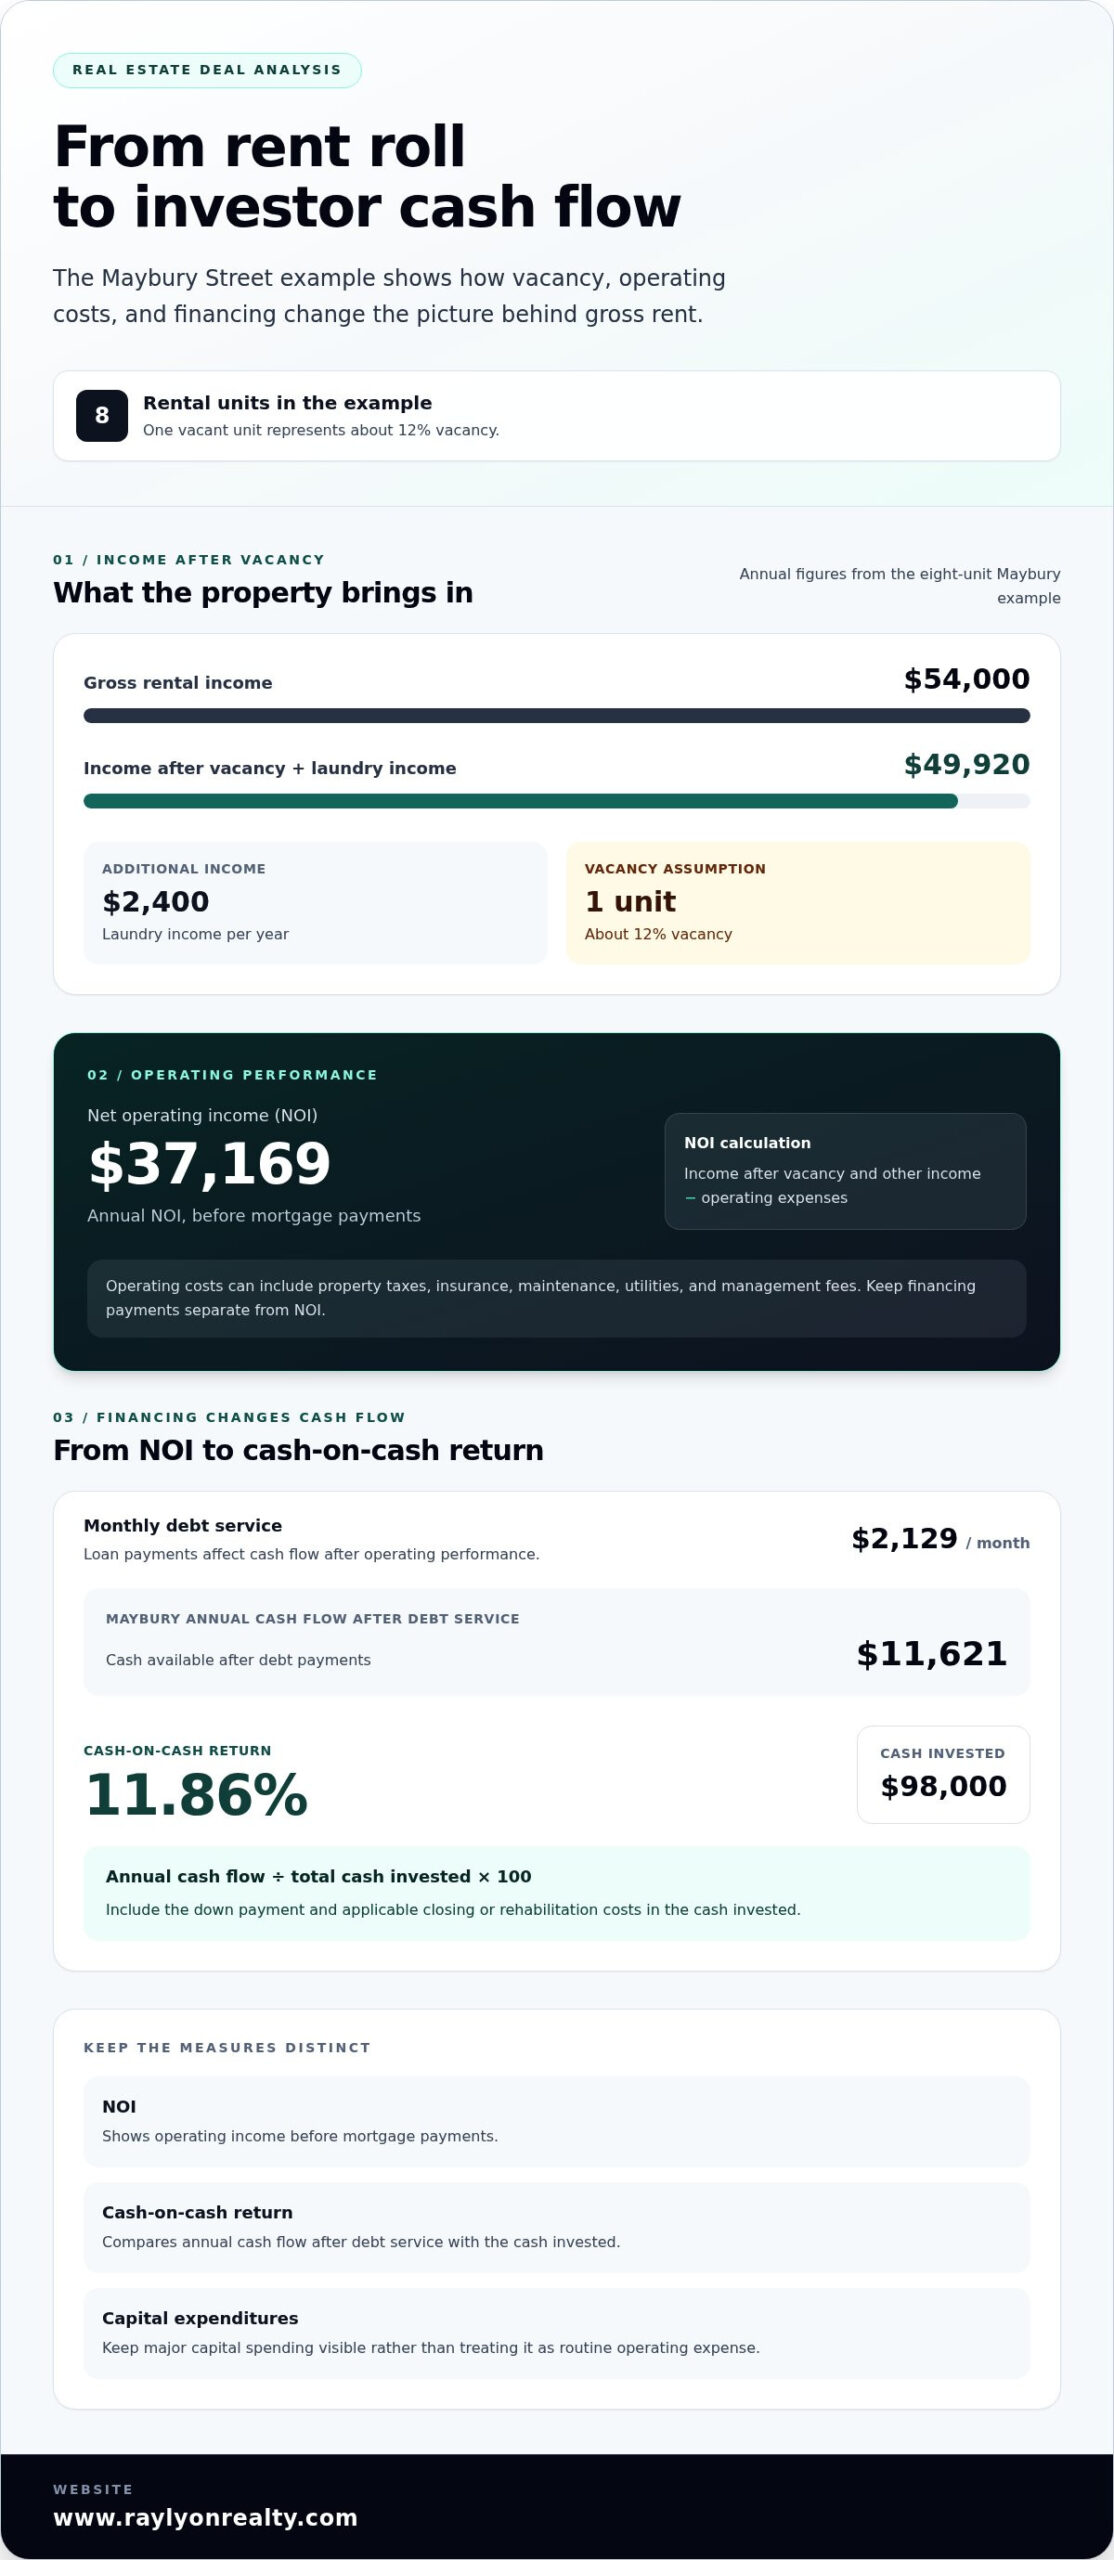
Financing costs and mortgage terms determine the debt payments and upfront cash used in a property’s return calculation. Include the down payment, loan payments, closing costs, and rehabilitation costs in the cash invested; account for interest and principal through the mortgage payment. A Maybury example has monthly debt service of $2,129, illustrating why loan terms can materially affect cash flow. For deals involving private capital or rehabilitation projects, private lenders like ahlhardmoney.com can provide the specific loan terms and fee structures needed to calculate total cash invested accurately.
Cash-on-Cash Return Calculation
Divide annual cash flow after debt service by total cash invested, then multiply by 100 to calculate cash-on-cash return. Include the down payment and applicable closing or rehabilitation costs in that investment basis. The Maybury example’s annual cash flow is $11,621 against an investment basis of $98,000, giving an 11.86% return. This helps compare opportunities with different financing structures.
Rental cash flow is net operating income minus debt service. For example, a property producing $200,000 in NOI, with $100,000 in debt service and $40,000 in capital expenditures, has $60,000 in net cash flow. Keep capital spending visible rather than treating it as routine operating expense, because it changes the cash available to the investor.
Calculate cap rate by dividing NOI by property price. Calculate cash-on-cash return by dividing annual cash flow by total cash invested. ROI compares total return with the investment basis, including the return components relevant to your analysis. Because these measures answer different questions, use them together to assess how a property fits your goals.
Calculate the debt service coverage ratio by dividing NOI by debt service. A higher ratio means more income is available to cover debt. Break-even occupancy estimates the share of potential rental income needed to cover operating expenses and debt payments. Together, these measures show how vacancy or lower rent could affect the property’s ability to meet its obligations.
Due diligence should include reviewing leases, property tax records, title reports, and financial statements. Inspect the property for repairs that could affect its value or performance, and assess tenant turnover, market volatility, depreciation, and financing risks. These findings can change projected expenses, income, or the cash needed to keep the investment performing.
Vacancy assumptions and income estimates
Estimate income using achievable rents, other property income, and a realistic vacancy assumption. Then subtract operating expenses to calculate annual net operating income.
Rental Income and Vacancy Estimates
Estimate rental income using market rents, historical vacancy, and potential rent increases. This helps you forecast how much income an apartment or other rental property may produce, rather than assuming every unit stays occupied all year.
In the eight-unit Maybury Street example, gross income is $54,000 annually, with $2,400 per year in laundry income. One vacant unit represents about 12% vacancy. After applying vacancy and adding laundry income, annual income is $49,920. The example shows why occupancy assumptions and additional income both matter.
Net Operating Income Calculation
Net operating income, or NOI, is rental income after vacancy and other income, minus operating expenses. It shows what remains before mortgage payments and helps compare a property’s operating performance without mixing in its financing.
The Maybury example has annual NOI of $37,169. To calculate NOI, start with income after vacancy, then subtract operating costs such as property taxes, insurance, maintenance, utilities, and management fees. Keep financing payments separate, because debt service is not an operating expense in this calculation.
Project annual income using current market rents and the property’s actual rental history. Separate rent from other income, such as laundry, and assess each source individually. Include a rent increase in your projection only when local market conditions and the property’s condition support it.
To estimate renovation costs and budget for unexpected repairs, inspect the property and create an itemized scope of needed work, materials, and labor. Separate immediate repairs from ongoing maintenance so each is reflected in the right part of your projection.
Estimate fair market value by comparing the property with nearby sales and adjusting for differences in location, condition, and features. Estimate after-repair value using comparable renovated properties, accounting for the planned work.
Discounted NOI estimates the present value of future operating income by applying a discount rate that reflects timing and investment risk. Project income and expenses over the holding period, then discount each period’s NOI. This approach helps show how changes in rent, vacancy, or expenses could affect value over time.
Local rent patterns shape vacancy and income assumptions. Explore Westside investment property opportunities as you compare a property’s projected income with its location and condition.
A separate gross-income example assumes a 10% vacancy rate. After applying a 10% vacancy rate, it estimates annual gross income at $10.8 million. This shows how a vacancy allowance can affect projected income, and why the assumption should reflect expected occupancy rather than treating every unit as occupied throughout the year.
Keeping these costs separate makes it easier to see how vacancy and ongoing operating expenses shape the income estimate. Use assumptions that fit the property, and review each one when projecting its annual performance.
Build-up method for estimating cap rates
The build-up method estimates a cap rate by adding risk adjustments to a base rate. It gives investors a structured way to connect an investment property’s financial risks with its required rate of return.
Start with a base interest rate, then add premiums for risks that make the property less predictable or harder to sell. In the example, a 6% interest rate plus adjustments of 1.5%, 1.5%, and 2.5% produces an 11.5% cap rate. Each adjustment represents a distinct risk, rather than an arbitrary increase.
Consider factors such as location, property condition, tenant stability, vacancy, and the reliability of projected expenses. A property with uncertain income may call for a different rate than one with stable operations. The method organizes these judgments, but it doesn’t replace a careful review of the property and its market.
Once you have a cap rate, use it with annual NOI to estimate value: divide NOI by the cap rate expressed as a decimal. For example, a property earning $200,000 in yearly income after expenses, at an 11.5% cap rate, is estimated to be worth about $1.74 million. A higher rate produces a lower estimated value when NOI stays the same.
This relationship also helps test an asking price. If the property’s NOI supports a lower value at the selected cap rate, take a closer look at income assumptions, expenses, and risk. If comparable properties indicate a lower rate, the estimated value rises, assuming NOI stays the same.
Cap rates vary by asset and deal. Commercial real estate cap rates are generally between 3% and 10%, though they can be higher or lower depending on the deal and asset class. For niche commercial properties like vehicle suites and storage units, specialists like The Garage Condo Guy demonstrate how specialized asset types can have their own unique occupancy and return profiles. The build-up example’s 11.5% reflects its chosen adjustments, not a universal benchmark. Compare the result with relevant properties and explain why each rate input fits the investment.
Keep the calculation unlevered: cap rate compares NOI with property value, not cash flow after mortgage payments with a down payment. Interest can inform the starting point in a build-up estimate, but mortgage debt service remains separate from NOI. This distinction lets investors compare operating income before different financing structures affect cash flow.
Use sensitivity checks to see how a changed assumption affects value. Recalculate with lower NOI if vacancy rises or expenses increase, then apply the selected cap rate again. For example, the $200,000 NOI illustration makes the impact of a rate adjustment visible without assuming a different loan. Documenting each input helps investors compare opportunities on consistent terms.
Assess how each variable impacts the final valuation while assuming every other input is fixed. Maintenance deserves particular attention: estimate expenses at 5% to 15% of rent, depending on a property’s condition and age. A realistic allowance can change NOI and, in turn, the value indicated by the same cap rate. The 1% rule can serve as an initial screen by comparing estimated monthly rent with 1% of the purchase price and repair costs, but it does not replace a property-specific income and risk review.
Debt service coverage ratio
The debt service coverage ratio (DSCR) compares a property’s net operating income with its required debt payments. Calculate it by dividing NOI by debt service for the same period. A ratio above one means operating income exceeds scheduled debt payments; a ratio below one means it falls short. This measure helps show whether rental operations can support a mortgage.
For example, a property with annual NOI of $16,800 and annual debt service of $15,000 has a DSCR of 1.12. The calculation is $16,800 divided by $15,000. The example also has annual cash flow of $1,800 before considering other items outside that calculation.
Match periods before calculating. Divide annual NOI by annual debt service, or compare monthly figures with monthly figures. Mixing a monthly mortgage payment with annual NOI produces a meaningless result. If a loan payment changes during the period, use the actual scheduled payments for that period. A consistent calculation makes it easier to compare properties and understand the margin between income and debt.
NOI reflects operating income after vacancy and operating expenses, but before mortgage payments. Debt service represents the payments required by the loan. Keep these categories separate: subtracting debt service before calculating NOI understates operating performance and counts financing twice. For an investment property, changes in rent, vacancy, taxes, insurance, or maintenance can affect NOI and therefore change DSCR.
Consider how assumptions affect coverage. If vacancy rises, collected rental income can fall while scheduled mortgage payments remain due. If operating expenses increase, NOI shrinks even when rents stay level. Average performance can also conceal weaker periods, so review income and debt payments over the same time frame. Compare the result using current assumptions with results under revised income or expense scenarios.
DSCR is useful alongside cash flow, cap rate, and cash-on-cash return because each measure answers a different question. Cash flow shows what remains after debt service; DSCR shows how much NOI is available relative to those payments. Together, these figures help investors assess operating strength, financing pressure, and the effect of changing assumptions before deciding whether an opportunity fits their criteria.
Loan structure affects the debt-service figure used in the calculation. The required payment depends on the mortgage’s principal, interest, and repayment terms, so use the payment schedule for the financing being analyzed. A lower payment can raise DSCR without improving the property’s operations. Separate these effects to see whether coverage comes from property income or financing structure.
Real estate deal analysis as a numbers-based process
A useful analysis brings income, expenses, financing, and local conditions together. Estimate performance consistently, then compare each real estate investment with your priorities.
Financial Metrics for Deal Analysis
Financial metrics translate a property’s income and costs into measures that support a purchase decision. Each highlights a different factor, so consider them together rather than relying on one attractive figure.
Calculate net operating income from income after vacancy, minus operating expenses. Divide NOI by price for cap rate, and divide annual cash flow after debt service by cash invested for cash-on-cash return. The debt service coverage ratio compares NOI with required debt payments. Monthly cash flow also shows how income and expenses affect your budget during ownership.
Return on investment can include cash flow and other return components, such as equity gained through mortgage principal reduction or appreciation. Keep projected gains separate from current income. This distinction clarifies available cash versus possible growth in value.
Comparing Deals and Setting a Purchase Price
Compare deals by applying the same assumptions and return measures to each property. Use consistent assumptions for rent, vacancy, expenses, financing, and holding period, then note where property condition or location changes the picture.
To set a maximum purchase price, divide projected annual NOI by the cap rate that fits your investment criteria. Then account for immediate repairs and other acquisition costs to determine the total capital the deal requires. This sets a price ceiling based on operating income, rather than the asking price alone.
Compare the result with comparable properties and your required cash flow, equity contribution, and financing terms. If one deal depends on optimistic rent growth while another supports its estimate with current income, that difference matters. Your maximum price should reflect the return you need and the risks you’re willing to accept.
Local Factors Affecting Deal Analysis
Local conditions affect both a property’s operating costs and its potential use. Property taxes and insurance affect expenses and NOI; zoning affects permitted uses and development options. Landlord laws can shape rental operations, expenses, and the timing of income.
For each property, include its tax records, insurance costs, zoning status, and applicable rental requirements in the same financial model. These factors can change projected income, operating costs, or your plan for the asset. A rent estimate alone cannot capture these local effects.
Market context helps test the assumptions behind the numbers. Compare property values and rental rates with nearby properties, and consider vacancy, job growth, population demographics, and infrastructure developments. These factors help you assess whether projected income and future demand fit the property’s location.
Before deciding, review the full picture: NOI, cap rate, cash-on-cash return, debt coverage, local costs, and your goals for appreciation or immediate cash flow. For support evaluating a Westside investment property, discuss local investment opportunities.
Ray Lyon Realty: New Construction Sales
Ray Lyon Realty helps buyers evaluate residential investment opportunities through Investment Property Sales and New Construction Sales. Turn to the team when your deal analysis points to a property you’re ready to pursue or when you’re comparing a new build with an existing home.
Bring your income assumptions, vacancy estimates, financing outline, and return priorities to the conversation. A clear picture of your goals and the property’s numbers can focus your search and inform your next steps. For an existing property, local market knowledge can add context to rental potential, condition, and comparable homes.
If you’re weighing an investment purchase or exploring new construction, contact Ray Lyon Realty to discuss your plans.
Turn Your Analysis Into a Clear Next Step
Knowing how to analyze a real estate deal is most useful when it helps you make a decision that fits your goals. Before moving forward, write down your key assumptions, such as expected income, financing structure, and ownership priorities. This gives you a practical basis for comparing opportunities and weighing what you’re prepared to take on.
If you’re ready to explore a purchase, connect your analysis to the property and transaction you have in mind. Ray Lyon Realty offers residential real estate representation, new construction sales, and luxury listing representation. A conversation can help clarify what you’re looking for and the next steps for a residential property.
Contact Ray Lyon Realty to discuss a deal. Move forward with a clear view of your priorities and a thoughtful plan for the opportunity ahead.
Frequently Asked Questions
What Is an Investment Property Analysis?
An investment property analysis reviews a property’s income potential, costs, financing, risks, and fit with an investor’s goals. It turns property information into a decision framework, rather than relying on the asking price or projected rent alone. To understand how to analyze a real estate deal, ask what evidence supports each assumption and how the property aligns with your plans for cash flow, equity growth, or resale.
How do you evaluate rental income, vacancy rates, and operating expenses?
Evaluate rental income by comparing projected rent with current leases and rents for similar nearby properties. To assess vacancy, review the property’s occupancy history and consider whether unit condition, tenant turnover, or local demand could affect future leasing. Check expense records for recurring costs such as taxes, insurance, utilities, and maintenance. Separate unusual, one-time repairs from ongoing expenses so the operating estimate reflects the property’s expected day-to-day performance.