
A 3.9-out-of-5 safety score puts Park West among Culver City’s highest-rated neighborhoods, tied with Studio Village. Culver City neighborhood safety ratings place both areas at the top of the local rankings, but a score is a useful starting point, not a guarantee of how every street or resident feels. Park West ranks well; the bigger question is how that rating fits the broader picture.
It’s reasonable to weigh local impressions alongside crime figures when choosing where to live. This guide brings those perspectives together so you can compare what residents say, what reported figures show, and how to interpret differences between neighborhoods.
You’ll find a closer look at Park West, a comparison of Culver City’s highest-rated areas for safety, and context on nearby places and more budget-conscious options. Use these insights to assess safety and location together as you plan your home search.
Key Takeaways
- Local views are mixed: in an AreaVibes survey of 39 residents, 49% said they felt safe walking at night, while 51% reported feeling unsafe.
- Fox Hills and Jefferson pair strong neighborhood safety scores with lower typical home prices than Studio Village, offering useful areas to compare in a home search.
- Reported property crime made up more of Culver City’s 2024 crime count than violent crime; the article explains why the categories matter when interpreting local safety.
- Nearby-area comparisons are most useful when you consider what each score measures, along with neighborhood-level differences and daily travel needs.
- For buyers considering a new build, Ray Lyon Realty’s New Construction Sales can help connect neighborhood priorities with available home options.
What Do the Locals Say About Crime in Culver City?
Culver City’s reported crime figures and residents’ opinions offer different perspectives on safety. Culver City neighborhood safety ratings are most useful when read alongside crime categories, local experiences, and the specific routes people use.
Crime Rates Against State and National Averages
A crime rate compares reported incidents with a population or another defined benchmark.
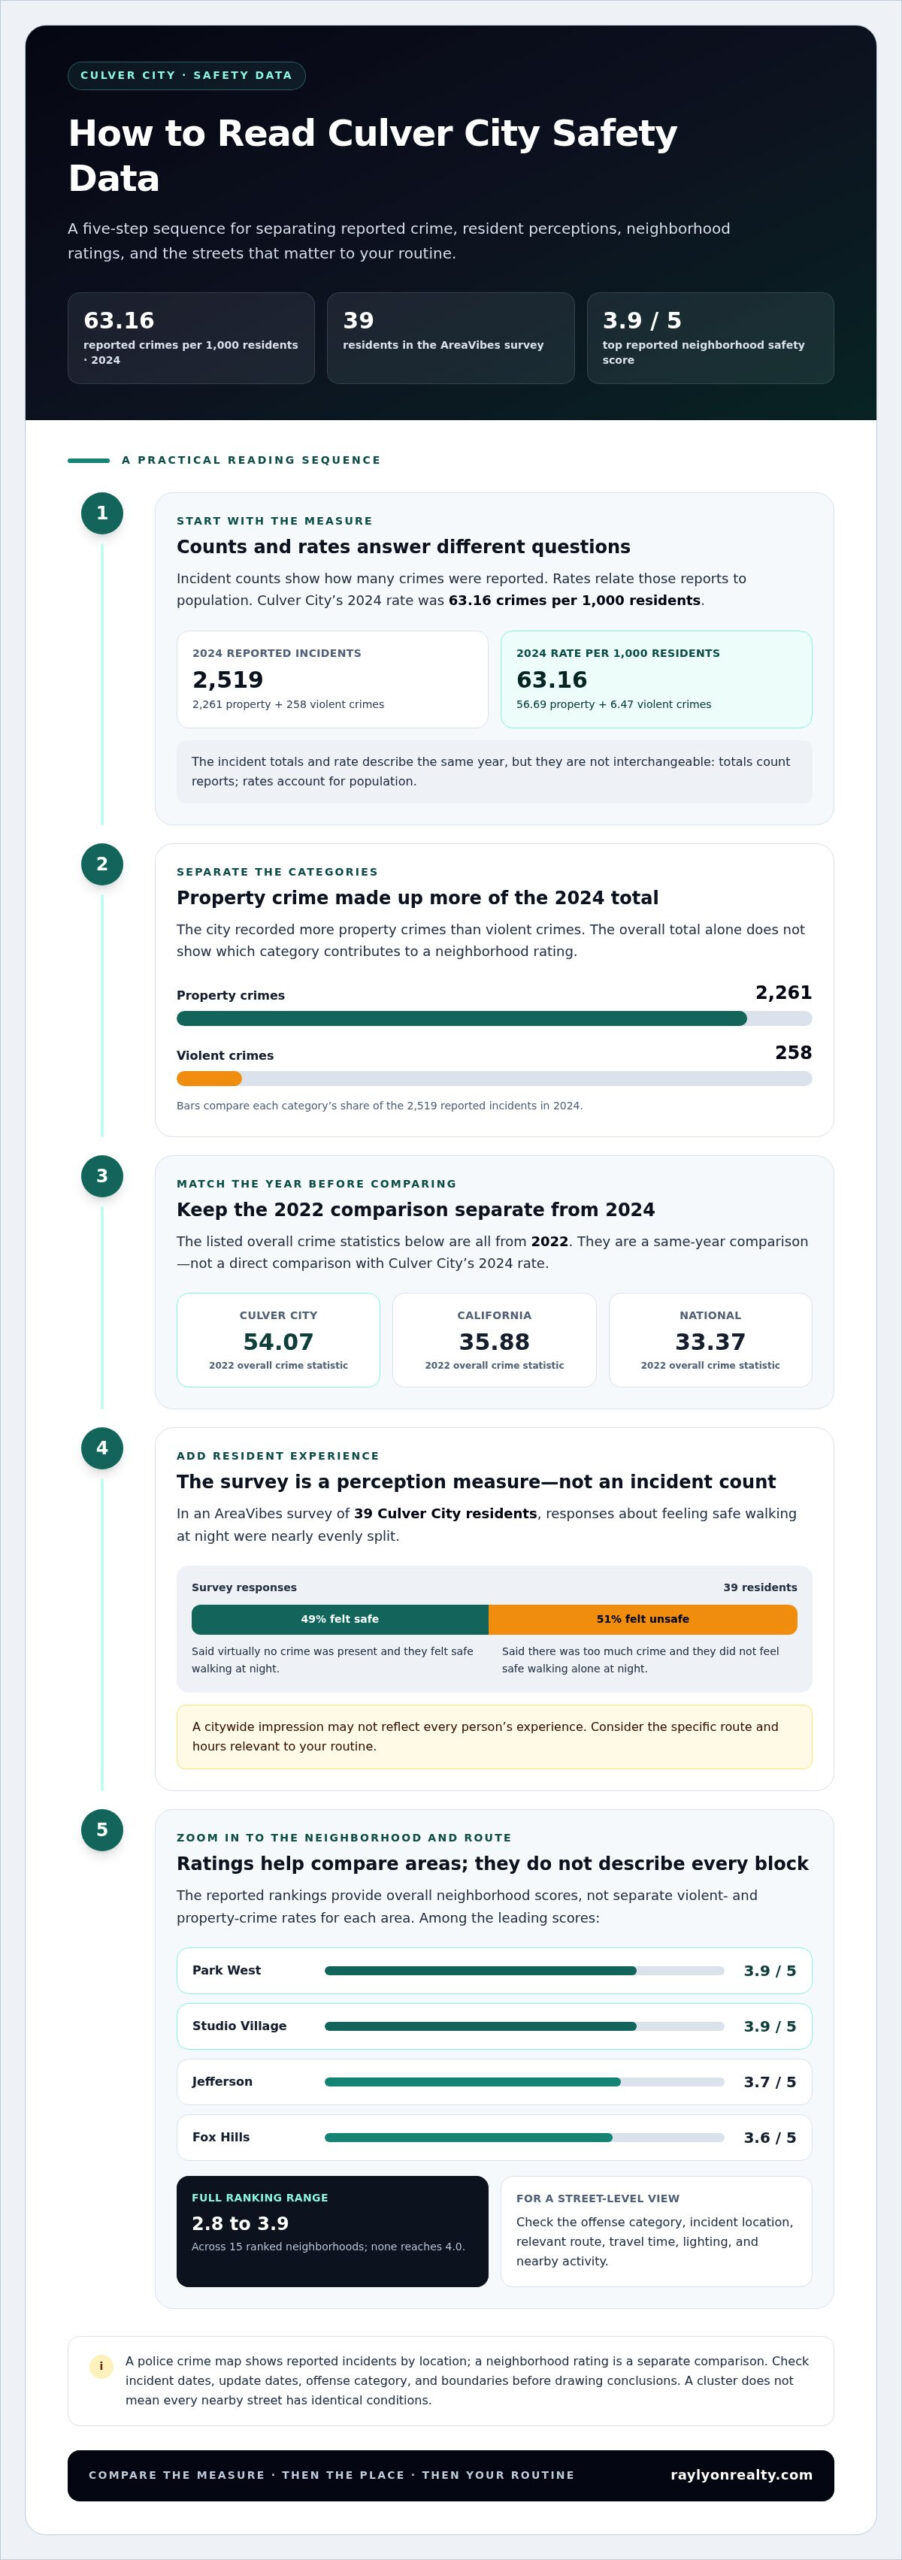
In 2024, Culver City recorded 63.16 crimes per 1,000 residents: 56.69 property crimes and 6.47 violent crimes. Reported incident totals can describe crime, but they do not account for population. Those counts and rates describe the same year but answer different questions: counts show incident totals, while rates account for population.
For a same-year comparison, the listed 2022 overall crime statistics were 54.07 for Culver City, 35.88 for California, and 33.37 nationally. Keep those 2022 figures separate from the city’s 2024 rate. Culver City’s poverty rate is 6.2%; that statistic provides context, but it does not explain individual crimes or predict safety on a particular block.
Residents’ Views on Crime and Nighttime Safety
Residents’ views describe personal perceptions, not police-recorded incident totals.
In an AreaVibes survey of 39 Culver City residents, 49% said virtually no crime was present and they felt safe walking at night. Another 51% said there was too much crime and they didn’t feel safe walking alone at night. This divide illustrates why a citywide impression may not reflect every person’s experience.
Use the survey as one perspective. For example, compare residents’ impressions of nighttime safety with the specific route and hours relevant to your routine.
Neighborhood Crime Rates and Police Maps
A police crime map displays reported incidents by location, making geographic patterns easier to examine.
The 2024 report recorded 2,261 property crimes and 258 violent crimes citywide. Those totals don’t identify the neighborhood with the highest rate. A location comparison requires neighborhood boundaries, a consistent time period, and population context. Culver City neighborhood safety ratings offer a separate way to compare areas, but a rating isn’t an incident map.
When reading a map, distinguish incident dates from update dates. Check the offense category and location, then consider the block and route that matter to you. A cluster of reports doesn’t mean every nearby street has identical conditions.
Crime Trends and Everyday Travel Safety
A five-year crime trend compares annual reports using consistent categories and geographic boundaries.
The 2024 figures are one annual snapshot; a five-year direction depends on comparing each year’s reports. For walking, biking, or public transit, assess your actual route, travel time, lighting, and nearby activity. For example, a transit trip involves different streets and conditions than a short walk to a local destination.
Online ratings summarize information according to their dates, boundaries, data sources, and scoring methods. Compare those details before using a rating to make a home decision. Culver City neighborhood safety ratings can help organize comparisons, while resident accounts and reported incidents add distinct context.
Safest Culver City neighborhoods
Park West and Studio Village share Culver City’s highest neighborhood safety score, with Jefferson close behind. The rankings offer a starting point for comparing areas, but they don’t replace a street-level look at a home and its surroundings.
How to Read Neighborhood Safety Scores
A safety score is a rating used to compare neighborhoods on an overall scale.
Park West and Studio Village each score 3.9 out of 5, the highest reported scores among Culver City neighborhoods. Jefferson follows at 3.7, while Fox Hills scores 3.6. The full set of 15 ranked neighborhoods ranges from 2.8 to 3.9, so none reaches 4.0. These results distinguish the leading areas, but a score alone doesn’t describe every block or daily experience.
The available rankings give overall neighborhood scores, not separate violent and property crime rates for each area. That distinction matters: an overall rating cannot tell you which category drives a neighborhood’s result. To compare areas carefully, note the score, its scale, and the neighborhood it describes. Then consider the specific location you’re evaluating, rather than treating the citywide picture as a precise description of one address.
Comparing the Highest-Rated Areas
Typical home prices provide another point of comparison alongside safety scores.
These figures show why it helps to compare safety and housing choices separately. Fox Hills and Jefferson have lower typical home prices than Studio Village in the listed comparison, while Studio Village ties Park West for the top score. A typical price is a neighborhood-level reference, not a price for every home. Property type and the specific home affect what a buyer encounters.
Turning Ratings Into a Home Search
Use Park West, Studio Village, Jefferson, and Fox Hills as comparison points, then narrow your search by location and property needs. For example, someone focused on a higher score can compare Park West with Studio Village; someone weighing score and typical price can also consider Fox Hills and Jefferson. The rankings help frame those trade-offs, but they don’t make the decision for you.
For an investment purchase, connect neighborhood comparisons to the property itself and your investment priorities. Investment Property Sales can support that search when you’re evaluating residential opportunities in Culver City.
Lower-priced neighborhoods with higher safety scores
Fox Hills and Jefferson offer a way to compare lower typical home prices with strong reported safety scores. Their figures are useful starting points, especially alongside Studio Village, but describe neighborhoods rather than every home or block.
What “Lower-Priced” Means in This Comparison
A lower-priced neighborhood here means one with a lower reported typical home price than the comparison area.
These figures make Fox Hills and Jefferson lower-priced alternatives in this set, but they don’t guarantee that every listing costs less.
A typical price summarizes an area; an individual property’s price depends on the home itself. Compare like with like: neighborhood-level typical prices against neighborhood-level scores, rather than assuming a score determines a home’s value.
How to Compare Price and Safety Scores
A safety score is a comparative rating, while a typical home price describes a neighborhood’s housing market.
Those measures answer different questions. Fox Hills’ 3.6 score does not mean its homes are priced according to safety, and Jefferson’s 3.7 score does not establish its violent crime rate. Use the rating to compare the listed areas, then consider the specific location and property separately. The available scores span 2.8 to 3.9 across Culver City’s 15 ranked neighborhoods.
- Compare Fox Hills and Jefferson: Their reported typical prices are lower than Studio Village’s, and both have scores above 3.5.
- Use Studio Village as a benchmark: Its 3.9 score matches the highest reported neighborhood score.
- Separate score from crime detail: An overall rating does not show which incidents occurred near a particular address.
For buyers, this comparison can help narrow an initial search without treating a neighborhood average as a personal budget. A home search in Jefferson, for example, can start with its reported score and typical price, then focus on the property’s location, condition, and fit. The same approach works in Fox Hills.
Price and safety are only two parts of a housing decision. Compare Fox Hills and Jefferson with Studio Village using the same measures, then weigh the specific home and its surroundings. This puts a lower typical price in perspective while preserving the neighborhood-level safety comparison.
Nearby neighborhood safety
Nearby comparisons work best when they use the same measure and reporting period. Culver City’s figures provide context, but safety scores and crime rates describe different things.
Comparing Nearby City Scores
A crime-and-safety score is a comparative index, not a count of reported offenses.
Inglewood has a crime-and-safety score of 51, while Los Angeles scores 50. Those figures can help frame a regional comparison, but they don’t show how many crimes occurred or how the cities compare by offense type. Culver City’s reported 2024 crime rate, for example, uses crimes per resident, a different measure entirely.
Keep the distinction clear: an index score reflects a ranking method, while an overall crime rate counts reported incidents relative to population. A comparison between Inglewood and Culver City is useful only when both figures use the same definition, time period, and geographic coverage. Don’t treat a one-point difference between scores as a direct measure of personal risk.
Putting Culver City’s Figures in Context
Crime density measures reported crimes across land area rather than per resident.
Culver City recorded 490 crimes per square mile in 2024. That figure answers a different question from the city’s total crime rate, because density reflects how incidents are distributed across physical space. A dense commercial corridor and a residential block may contribute differently to a citywide measure, so density alone cannot describe an individual address.
The reported victimization estimates offer another lens: the chance of property-crime victimization was one in 18, while the chance of violent-crime victimization was one in 155. These are citywide estimates, not forecasts for a particular street. Compare them with the offense categories and geography used in any nearby-city figures.
Making a Useful Local Comparison
A meaningful nearby-area comparison matches the measure, period, and place before interpreting results.
Use this sequence when comparing Culver City with Inglewood or Los Angeles:
- Identify the measure: Separate an index score from an overall crime rate or crime density.
- Match the period: Compare figures from the same reporting year, such as Culver City’s 2024 data.
- Match the geography: A citywide result doesn’t describe every neighborhood or street.
- Separate offense types: Property crime and violent crime should not be collapsed into one conclusion.
For a home search, apply that comparison to the actual location and your routine. A home near a commercial area, for example, may sit within a different pattern of activity than a home on a residential street elsewhere. Nearby-city figures help frame the broader region; neighborhood-level context and your routes to work, transit, or daily errands make the comparison more relevant.
Which Culver City neighborhoods have the highest reported crime rates?
A neighborhood crime rate compares reported offenses with the population in that neighborhood. The available Culver City neighborhood figures rank safety scores, not crime rates, so they don’t establish which neighborhood has the highest reported crime rate.
That distinction matters. A low safety score is not itself a count of offenses, and a citywide crime total cannot identify the neighborhood with the most incidents. Culver City’s ranked neighborhoods have safety scores from 2.8 to 3.9 out of 5. Those scores provide a neighborhood comparison, but they don’t show separate violent-crime or property-crime rates.
Clarkdale has the lowest reported safety grade, B-. That grade does not establish that Clarkdale has the city’s highest reported crime rate. Treating it as proof would confuse a grade with a rate and could mislead a home search. The same caution applies to a neighborhood with a higher safety score: the score alone doesn’t provide an address-level crime history.
To identify a neighborhood crime-rate leader, compare reported incidents and population using matching boundaries and the same reporting period. A raw count can make a more populated area appear higher simply because more people live there. A rate adjusts the count for population, while a map shows where reports occurred. These measures answer related but different questions.
Also separate offense categories. Violent crime and property crime describe different types of reported incidents, so a combined overall figure can hide differences between them. A neighborhood could show different patterns across those categories, but safety scores alone don’t reveal them. Use the measure that matches your concern, then focus on the specific area you’re considering.
For a practical comparison, start with the neighborhood name and boundary, then align the reporting period and offense category. Next, distinguish a rate from a count or score. Finally, relate the result to the particular block and your daily routes. This prevents citywide statistics or broad grades from standing in for neighborhood-level evidence.
The key takeaway is precise: Culver City’s available neighborhood rankings do not name a highest-crime neighborhood. They identify safety scores, including Clarkdale’s B- grade, which should not be presented as a crime-rate ranking. For a home search, use those ratings as one comparison point alongside the exact location and property.
If you’re comparing Culver City homes, explore residential property options with neighborhood priorities in mind.
The available rankings do not identify a neighborhood with the highest reported crime rate; Clarkdale’s B- safety grade is not a crime-rate ranking.
The available neighborhood safety scores do not show separate violent-crime and property-crime rates, so they cannot establish how those rates vary by neighborhood.
Ray Lyon Realty: New Construction Sales
Ray Lyon Realty helps buyers explore new construction when a newly built home fits their location and property goals. After comparing Culver City neighborhoods, use your priorities around safety, commute, and home style to shape your search. A residential Realtor can also help you weigh existing homes, while Investment Property Sales may suit those assessing a property for investment. Sellers considering a high-end home can explore the Luxury Listing Agent offering.
Neighborhood ratings are one part of a real estate decision. Pair them with the specific property and the way you plan to use it. To discuss your home search or sale, contact Ray Lyon Realty.
Make Your Next Home Search More Intentional
Let Culver City neighborhood safety ratings inform your search, then turn your priorities into practical criteria: the setting you prefer, the routes you use, and the kind of home that fits your plans. This keeps ratings in perspective as you compare real properties and locations.
Ray Lyon Realty can help you move from research to a residential decision, whether you’re considering an existing home, new construction, or a luxury property. Bring your questions and the features that matter most to your search. A focused conversation can help you decide what to explore next.
Contact Ray Lyon Realty for local guidance, and take the next step toward finding a home that feels right for you.
Frequently Asked Questions
Is Park West in Culver City safe?
Park West is among Culver City’s highest-rated neighborhoods for safety, based on its reported neighborhood score. That rating is a comparison tool, not a guarantee about every street or a measure of one person’s risk. For a practical assessment, consider the specific home’s surroundings, the routes you’d use regularly, and how those places feel during the hours you expect to be out.
What are the safest neighborhoods in Culver City?
Park West and Studio Village lead the reported neighborhood safety rankings, with Jefferson next. Fox Hills also scores relatively highly in the local comparison. These rankings help narrow a home search, but they don’t show every factor that matters to a resident. For example, someone choosing between two homes may weigh neighborhood score alongside proximity to daily destinations and preferred travel routes.
What are the latest crime rates in Culver City, California?
The latest figures in this guide cover 2024: Culver City’s total crime rate was 63.16 crimes per 1,000 residents. The violent crime rate was 6.47, and the property crime rate was 56.69 per 1,000 residents. Reported counts add detail: the city recorded 198 motor vehicle thefts and 237 burglaries. Rates and counts describe different things, so keep both in view.
How do Culver City crime rates compare with Los Angeles County and California averages?
For a same-year comparison with California, Culver City’s 2022 overall crime statistic was 54.07, compared with 35.88 for the state. A valid Los Angeles County comparison needs the countywide rate from the same year, using the same per-resident method. City and county figures cover different geographic areas, so comparing unmatched totals can mislead rather than clarify local risk.
Which Culver City neighborhoods have the lowest reported crime rates?
The neighborhood rankings compare safety scores, not reported crime rates, so they don’t identify which area has the lowest crime rate. Park West and Studio Village have the top safety scores, while Clarkdale has the lowest reported safety grade. To compare reported crime itself, use neighborhood-level incident rates with matching reporting periods and boundaries; an overall grade cannot substitute for those figures.
How safe is Culver City for walking, biking, and public transit?
Safety can vary by route, travel time, lighting, and nearby activity, so assess the streets you would actually use. Residents’ nighttime views are mixed: 49% of surveyed residents felt safe walking at night, while 51% did not feel safe walking alone.
How do violent and property crime rates vary across Culver City neighborhoods?
The available neighborhood rankings provide overall safety scores, not separate violent- and property-crime rates for each neighborhood. Citywide, the 2024 rates were 6.47 violent crimes and 56.69 property crimes per 1,000 residents.
How have crime trends in Culver City changed over the past five years?
The article gives 2024 as an annual snapshot, not a five-year trend. To assess change over five years, compare each year’s reports using consistent crime categories and geographic boundaries.