
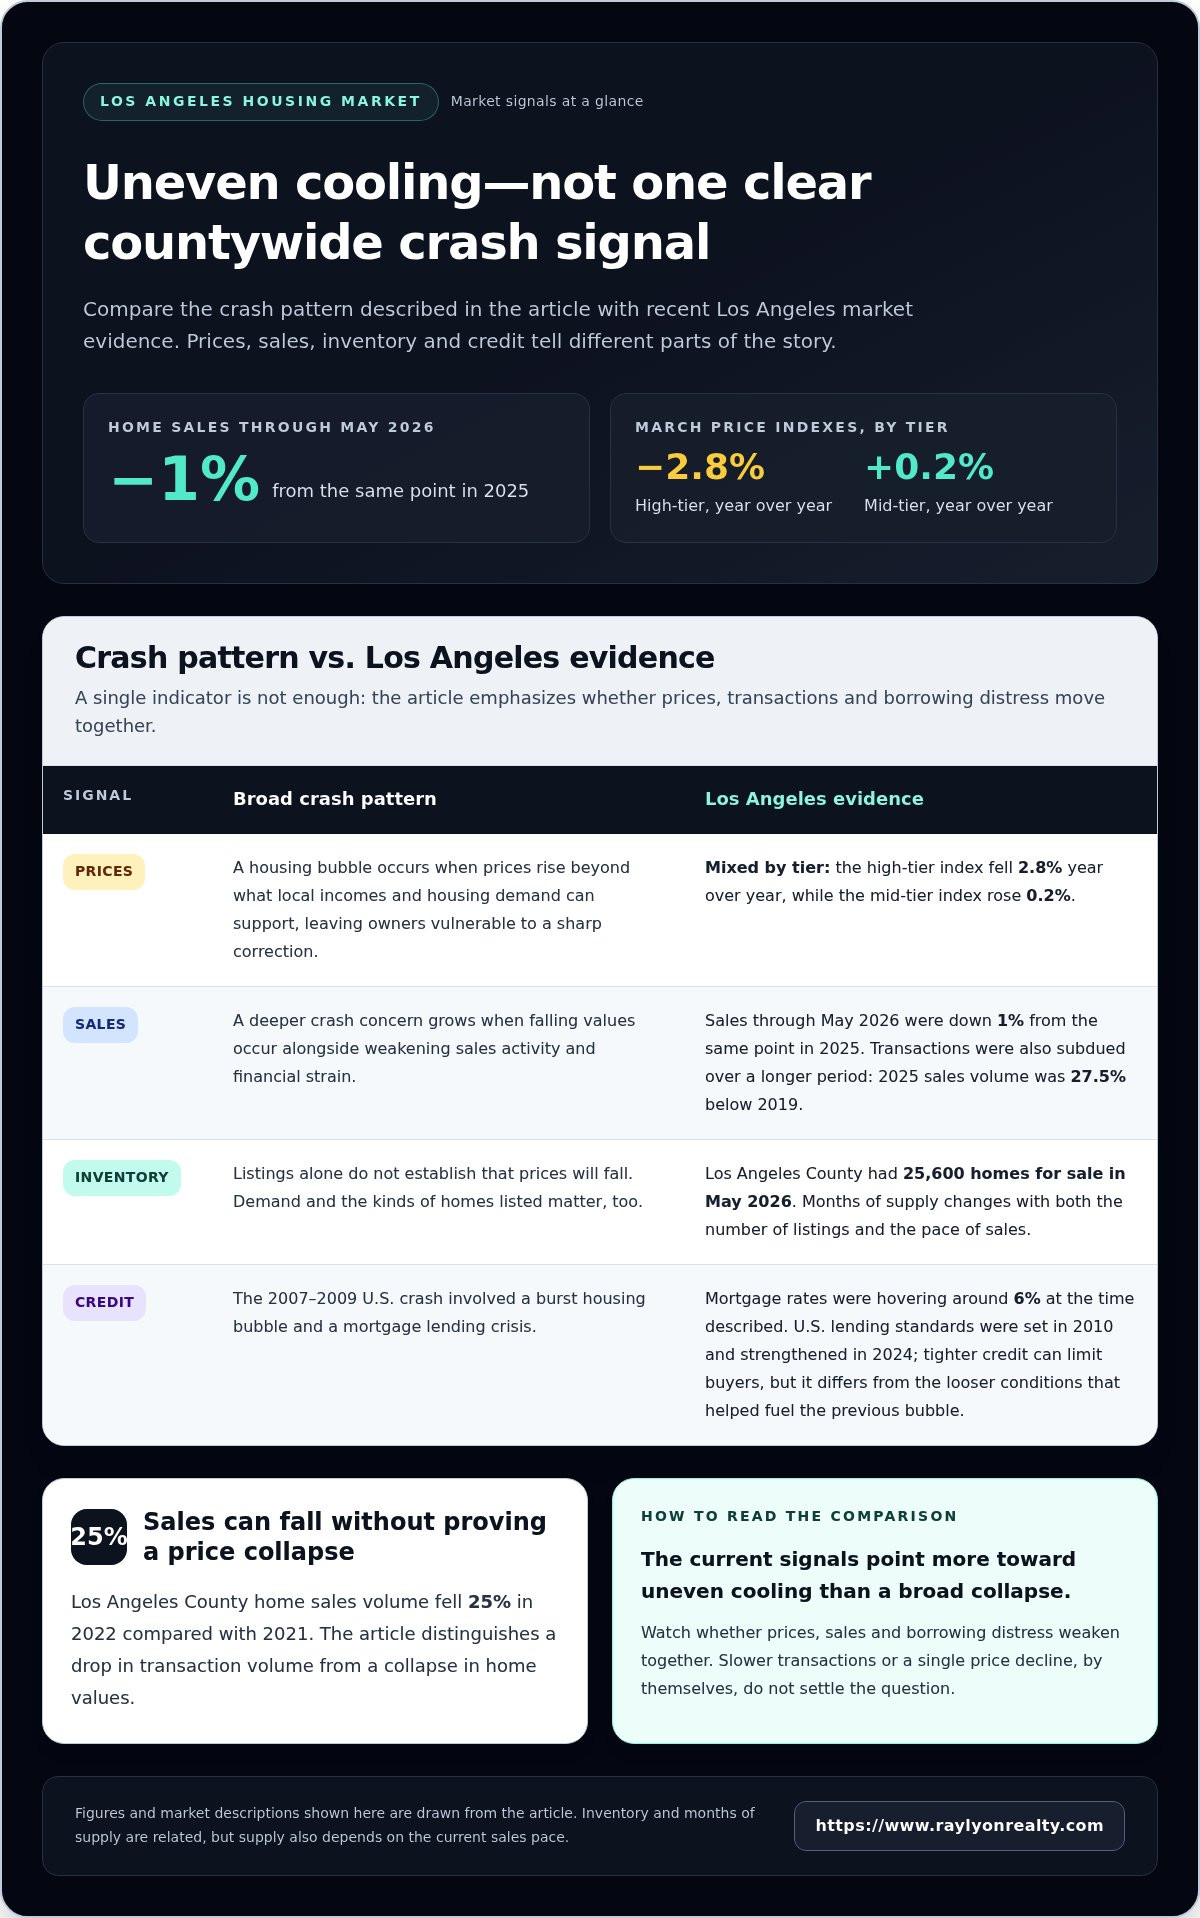
A Los Angeles housing crash isn’t the clearest reading of the market right now. Through May 2026, home sales were down 1% from the same point in 2025, while March prices varied by tier: the high-tier index fell 2.8% year over year, but the mid-tier index rose 0.2%. The evidence points more toward uneven cooling than a broad collapse, so the question of whether the Los Angeles housing bubble is going to burst calls for more than a headline-driven answer.
It’s understandable to worry about a bubble when homes feel expensive and sales slow. But a quieter market doesn’t automatically mean prices are about to plunge. Affordability, inventory, buyer demand, and the strength of the local economy help distinguish a correction from a crash.
This article explains what Los Angeles market signals suggest, how current conditions compare with a housing-bubble crash, and which forces could keep prices elevated or push them lower. You’ll get a clearer sense of whether the market is correcting, cooling through a normal cycle, or showing signs of deeper trouble.
Key Takeaways
- Separate a broad housing crash from a market correction by looking at prices, sales activity, inventory, and mortgage distress together.
- Understand how limited housing supply, borrowing costs, and buyer demand can push Los Angeles home prices in different directions.
- Use affordability and monthly housing costs to assess how much demand local buyers can sustain.
- Compare today’s conditions with past boom-and-bust cycles to spot the difference between normal cooling and bubble warning signs.
- Explore how Ray Lyon Realty’s new construction sales, luxury listing, and investment property services can fit your next real estate decision.
Los Angeles Housing Market: Crash or Correction Now?
Los Angeles shows signs of a slower, uneven market, not one clear signal of a countywide crash. Sales, inventory, prices, and household mobility each reveal a different part of the picture.
Bubble Effects on Owners and the Economy
A housing bubble forms when prices rise beyond what local incomes and housing demand can support, leaving homeowners and the wider economy vulnerable to a sharp correction. Falling home values can reduce owners’ equity, while lower spending and construction can affect jobs and economic activity.
Renting and owning also show different levels of mobility. In 2024, renter turnover in Los Angeles County was 12.5%, compared with homeowner turnover of 4.1%. That gap helps explain why rental demand can keep moving even when owners stay put. Turnover measures household movement, though, not rent levels or the number of homes available to rent.
Long holding periods shape the local market, too. The county’s homeowner turnover rate was once every 22 years at the time described, so fewer owners may list when they have little reason to move. Mortgage-rate lock-in can reinforce that pattern: the share of U.S. homeowners with mortgage rates above 6% now outnumbers the share with rates below 3%. Owners with lower-rate loans may be reluctant to trade them for more expensive borrowing.
Inventory and Months of Supply
For-sale inventory counts homes currently listed; months of supply estimates how long that inventory would take to sell at the current sales pace. Los Angeles County had 25,600 homes for sale in May 2026. The months-of-supply calculation compares that inventory with the pace of monthly sales, so it changes when either listings or sales change.
Sales volume adds context to the listing count. The county recorded 50,000 home sales in 2025, and sales through May 2026 were down 1% from the same point in 2025. A buyer may see more choices when listings build, while a seller must account for nearby competition. Inventory alone doesn’t establish whether prices will fall; demand and the kinds of homes listed matter, too.
Past Crash and Regional Comparisons
The 2007-2009 U.S. crash involved a burst housing bubble and a mortgage lending crisis. Los Angeles County’s home sales volume fell 25% in 2022 compared with 2021, but a drop in sales is not the same as a collapse in home values. Sales volume was also 27.5% below its 2019 level in 2025, showing a longer period of subdued transactions.
Los Angeles County’s homeownership rate was 49.2% in Q1 2026, below California’s 55.7% in the same quarter. The county rate had reached a low of 45% in Q3 2016. These differences show why statewide conditions cannot stand in for every local market. For homeowners, the practical distinction is whether values, sales, and borrowing distress are falling together, or whether transactions are simply slow.
Factors that can drive home-price increases
Los Angeles home prices respond to supply, buyer demand, borrowing costs, and ownership expenses. These forces can support prices in one market segment while putting pressure on another.
Price Trends and Bubble Risk
Price trends show whether rising values reflect durable demand or momentum that could reverse, a distinction that matters when assessing bubble risk. U.S. home prices rose roughly 20% over the five years preceding June 2026, while California was producing 50,000 fewer housing units per year than needed to accommodate newcomers. Persistent supply shortages can support values, but rapid appreciation can stretch buyers’ budgets.
The share of Los Angeles homes selling below asking or receiving price cuts varies with listing strategy, property condition, and competing homes. An asking price is a seller’s starting point, not proof of market value. Compare similar recent sales and the home’s condition to judge whether a price reduction signals weaker demand or an unrealistic starting price.
Rising interest rates, stricter credit, or a sharp drop in demand could trigger a crash. These pressures become more serious when they coincide with falling prices and financial strain. Insurance costs, property taxes, and housing regulations also affect values: higher carrying costs can limit buyers’ budgets, while rules that constrain construction can restrict new supply.
Mortgage Rates and Price Outlook
Mortgage rates affect the monthly cost of borrowing, which influences how much buyers can bid and how many can qualify. Rates were hovering around 6% at the time described, and rising rates can reduce demand. Stricter credit standards can also limit financing, leaving fewer buyers able to compete for homes.
The outcome depends on how these pressures interact with supply and household finances over time. U.S. mortgage lending standards were set in 2010 and strengthened in 2024, after the lending crisis linked to the 2007-2009 crash. Investors and homeowners should distinguish that tighter lending environment from the looser credit conditions that helped fuel the previous bubble.
Luxury homes can face sharper negotiation when asking prices outrun buyer expectations. Josh Flagg said some sellers overprice properties by a third, and that substantial overpricing may lead to sales 10 to 15 percent below value. These examples illustrate pricing risk, not a forecast for every property.
For a higher-end property, a luxury listing strategy can help sellers position the home around its features and local competition. A defensible asking price matters because an overpriced listing can lose buyer interest while comparable homes remain available.
Housing affordability and buyer spending
Affordability indicates how much local buyers can spend without stretching their household budgets. In Los Angeles, a limited pool of qualified buyers can sustain competition for desirable homes, while tight purchasing power can slow sales when borrowing costs rise. This tension helps explain why high prices and weaker demand can coexist.
As of August, 24% of Los Angeles residents could afford to buy a median-priced home. That figure puts a practical limit on the local buyer pool. When fewer households can qualify, sellers may need to adjust expectations, especially if comparable listings give buyers more choice. Buyers, meanwhile, may compare monthly costs with the value and location they can reasonably afford.
California’s affordability picture shows the income pressure behind those decisions. The minimum household income required to buy a median-priced home in California was $93,490, assuming a 30-year fixed-rate mortgage and a 20% down payment. In August, 21% of California households earned at least that amount. The gap between required income and household earnings can limit demand even when buyers want to own.
National comparisons offer context, not a substitute for Los Angeles figures. In August, 56% of people nationwide could afford a median-priced home in their communities. In June 2026, the typical U.S. homebuyer spent about 34% of income on housing. Those measures show how monthly payments compete with other expenses, while local incomes, home prices, and mortgage terms shape each buyer’s actual budget.
Housing demand can shift quickly when costs rise faster than buyers’ capacity. Demand fell sharply in 2022-2023 as mortgage rates spiked and affordability collapsed. Higher borrowing costs reduce the amount buyers can finance at a given monthly payment. That can lead some households to delay purchasing, choose a less expensive property, or remain renters, reducing pressure on asking prices.
First-time buyers face a particular hurdle because they may not have proceeds from a previous home sale. In August, first-time buyers accounted for 30% of California homebuyers. In 1995, they represented more than 50%. The contrast illustrates how affordability can affect who enters the market, not just how many homes sell. A thinner first-time buyer pool can also reduce move-up demand over time.
For buyers, compare the full monthly housing commitment with income, rather than focusing only on the purchase price. The average Los Angeles resident with a mortgage spent 27.1% of income on housing in 2021, while the typical U.S. homebuyer spent about 34% in June 2026. These figures cover different places and periods, but both show why payment capacity matters. U.S. home prices could return to normal by 2030, when a median earner could afford a median-priced house while spending 30% of income on monthly payments.
Housing bubble definition and warning signs
A housing bubble is a sustained rise in home prices driven partly by expectations of further gains, rather than housing fundamentals alone. To judge whether Los Angeles faces that risk, look beyond prices to lending, payment stress, and forced sales.
Defining a Housing Bubble
Rising values don’t prove a bubble by themselves. Concern grows when buyers and investors keep paying more because they expect prices to continue climbing, even as affordability weakens. That distinction matters to homeowners: if prices fall, owners with little equity may face difficult choices about selling or refinancing.
The U.S. experience before the Great Recession shows how risky lending can amplify price growth. In 2005 and 2006, an estimated 20% of U.S. mortgages went to subprime borrowers who wouldn’t qualify under typical standards. More than 75% of U.S. subprime loans in those years were adjustable-rate mortgages with low introductory rates that reset after two to three years.
Those resets could raise monthly payments and put pressure on borrowers unable to afford the new amount. A bubble becomes more dangerous when rising prices depend on easy credit and buyers’ expectations rather than sustainable demand. That’s why a price slowdown alone doesn’t prove a bubble has burst.
Market Warning Signs and Distress
Warning signs include increases in missed mortgage payments, foreclosure filings, and distressed sales, especially when they rise together. Each reflects a different stage of financial strain, so distinguish a borrower falling behind from a completed foreclosure or a pressured sale.
Mortgage delinquencies, foreclosures, and distressed sales are separate indicators, and a national foreclosure count cannot establish whether all three are increasing in Los Angeles County. The United States recorded 357,062 foreclosure filings in 2023, compared with over 2.8 million foreclosures in each of 2009 and 2010. Those national figures provide historical context, not a current county trend.
The previous crash was linked to a housing bubble and mortgage lending crisis during the Great Recession of 2007-2009. Lending standards were set in 2010 and strengthened in 2024, changing the credit backdrop from that period. Still, tighter standards can reduce demand, while rising interest rates can make payments harder for new borrowers.
In Los Angeles, assess whether payment stress is spreading alongside falling prices and forced sales, rather than treating one indicator as a verdict. More listings may reflect owners choosing to move; distressed sales point to financial pressure. Keeping these signals distinct helps you interpret uncertainty without assuming every price decline signals a crash.
Natural housing-market cycles
Housing markets move through periods of rising prices, slower sales, and recovery as demand, borrowing costs, jobs, and construction change. Recognizing those shifts helps buyers and sellers separate an ordinary adjustment from a deeper downturn.
California’s long-term price history includes both growth and setbacks. Home prices appreciated an average of 8.3% per year from 1969 onward, but that average doesn’t mean values rose steadily every year. From 1988 to 1995, annual sales of existing detached single-family homes in California fell by 112,279 units, a decline of almost 25%.
Los Angeles County also experienced a prolonged price decline in the early 1990s. That history shows how a local market can take years to recover after a downturn, rather than shifting immediately from falling prices to renewed growth.
The nationwide cycle before the Great Recession was different in scale and cause. The U.S. median sales price of homes rose 55% from 2000 to 2007, then housing prices declined 19% from 2007 to 2009. The decline followed a housing bubble and mortgage lending crisis, so it’s a useful comparison, not a template for every Los Angeles slowdown.
Construction can influence cycles by changing the balance between new homes and population growth. During the late 1980s, builders constructed one new housing unit for every two-person increase in the population. During the past couple of years, builders constructed one new housing unit for every six-person increase. More limited building can constrain supply and support prices, even as higher borrowing costs weaken buyers’ spending power.
Local construction is another piece of the picture: Los Angeles County recorded 9,600 single-family residential construction starts in 2025. Starts indicate new building activity, but they don’t instantly add completed homes to the market. Construction timelines and the types of homes being built affect how much new supply reaches buyers.
For buyers, a cooling period can mean more time to compare condition, location, and asking price. Sellers can respond by pricing against comparable homes and current buyer demand, rather than relying only on past highs. If you’re planning a Los Angeles sale, discuss your home-selling strategy in light of current local conditions.
Ray Lyon Realty: New Construction Sales
Ray Lyon Realty helps buyers assess new construction opportunities and supports sellers whose decisions depend on current local conditions. If you’re comparing a newly built home with an existing property, consider how location, features, and long-term ownership costs fit your plans. For sellers, a luxury listing strategy can position a property around its condition and competing homes. Investors can also explore investment property sales, including specialized transactions such as 1031 exchanges and trust sales.
Market uncertainty doesn’t make every purchase or sale the right move. Understanding your goals and a property’s place in the local market can help you decide what to do next. Contact Ray Lyon Realty to discuss your Los Angeles real estate plans.
Make Your Next Move With a Local Perspective
If you’re still asking whether the Los Angeles housing bubble is going to burst, focus your next decision on the property and your goals, not a prediction alone. Buyers can weigh location, condition, and affordability; sellers can compare their home with nearby listings. The right timing depends on what you want to achieve and the options available to you.
Ray Lyon Realty offers residential real estate representation, new construction sales, and luxury listing services. Whether you’re preparing to sell or considering a purchase, a conversation can clarify which factors matter most in your situation. You don’t need to predict the entire market to make a thoughtful move. Start with the home, your plans, and the local conditions that affect them.
Contact Ray Lyon Realty to discuss your next Los Angeles real estate move. A clear plan can make the next step feel more manageable.
Frequently Asked Questions
What Is a Housing Bubble?
A housing bubble occurs when home prices rise beyond what underlying demand and buyers’ finances can sustain, often because people buy expecting further gains. Prices can fall if expectations change or buyers lose access to credit. For a homeowner, the practical concern is whether a sale would cover the remaining mortgage and transaction costs, not simply whether an earlier estimate showed a higher value.
Are Los Angeles home prices overvalued compared with incomes and rents?
Los Angeles homes are difficult to afford relative to local incomes, but that alone doesn’t prove prices are overvalued compared with rents. As of August, 24% of Los Angeles residents could afford a median-priced home. A price-to-rent comparison also depends on actual rents, property expenses, and the cost of borrowing. For a specific home, compare its likely ownership costs with comparable rentals and nearby sales.
Are Los Angeles home prices rising or falling in 2026?
Price direction in Los Angeles County varies by home-price tier. In March 2026, the high-tier home price index declined 2.8% year over year, while the mid-tier index increased 0.2% and the low-tier index declined 0.3%. Those figures describe different segments, so a buyer or seller should compare similar properties rather than assume one countywide trend applies to every neighborhood and home type.
How affordable are homes in Los Angeles compared with historical levels?
Affordability remains challenging for local buyers, and comparisons across time depend on income, mortgage rates, down payments, and home prices together. One historical reference is California’s average home-price appreciation of 8.3% per year from 1969 onward, though that long-run figure doesn’t show how affordable homes were in any particular year. To assess your own position, compare expected monthly costs with household income and other obligations.
What are forecasts for Los Angeles home prices over the next 1 to 3 years?
Current expectations point to home prices normalizing through 2026 and beyond as the market adjusts, rather than providing a guaranteed direction for every Los Angeles property. Whether the Los Angeles housing bubble is going to burst depends on how prices, buyer demand, mortgage access, and household finances develop together. For your decision, consider how long you plan to own, whether payments fit your budget, and how local comparable sales are changing.