
What if a property that shows negative cash flow on day one is actually the smartest financial move you’ll make in 2026? In the high-stakes Westside LA market, looking at a basic spreadsheet often leads to a “no” when the real answer is a “yes.” You aren’t alone if you’re staring at $1.8 million entry prices and wondering how the math could ever work with California’s intricate rental laws. It’s completely natural to fear a deficit in your first twelve months when the average Westside cap rate hovers around 3.2 percent.
That’s why using a specialized investment property ROI calculator california investors rely on is more than just a convenience; it’s a survival tool for the modern market. I’ve spent years flipping homes and managing rentals here, and I’ve learned that the block to block math is what separates the winners from the sidelined. This guide gives you a clear go/no-go framework designed for the 2026 Westside landscape. You’ll discover how long-term appreciation offsets lower initial cash flow and how adding a 750 square foot ADU can flip your ROI from red to black. We’re moving beyond the surface level to find the hidden value-add opportunities that others miss.
Key Takeaways
- Understand the “California Paradox” and why savvy Westside investors often prioritize massive long-term appreciation over immediate high yields.
- Learn how to calibrate your investment property ROI calculator california to account for 2026 tax structures and the reality of the 1% Rule myth.
- Master “block-to-block” market analysis to identify the specific ROI differences between Santa Monica luxury assets and Mar Vista multi-family units.
- Discover how to utilize the “ADU Advantage” and strategic “lipstick” renovations to significantly increase your rental income and property value.
- Gain a competitive edge by learning how off-market deals and professional contractor networks provide a “true” ROI that spreadsheets alone can’t capture.
Why the California Investment Property ROI Calculation is Different
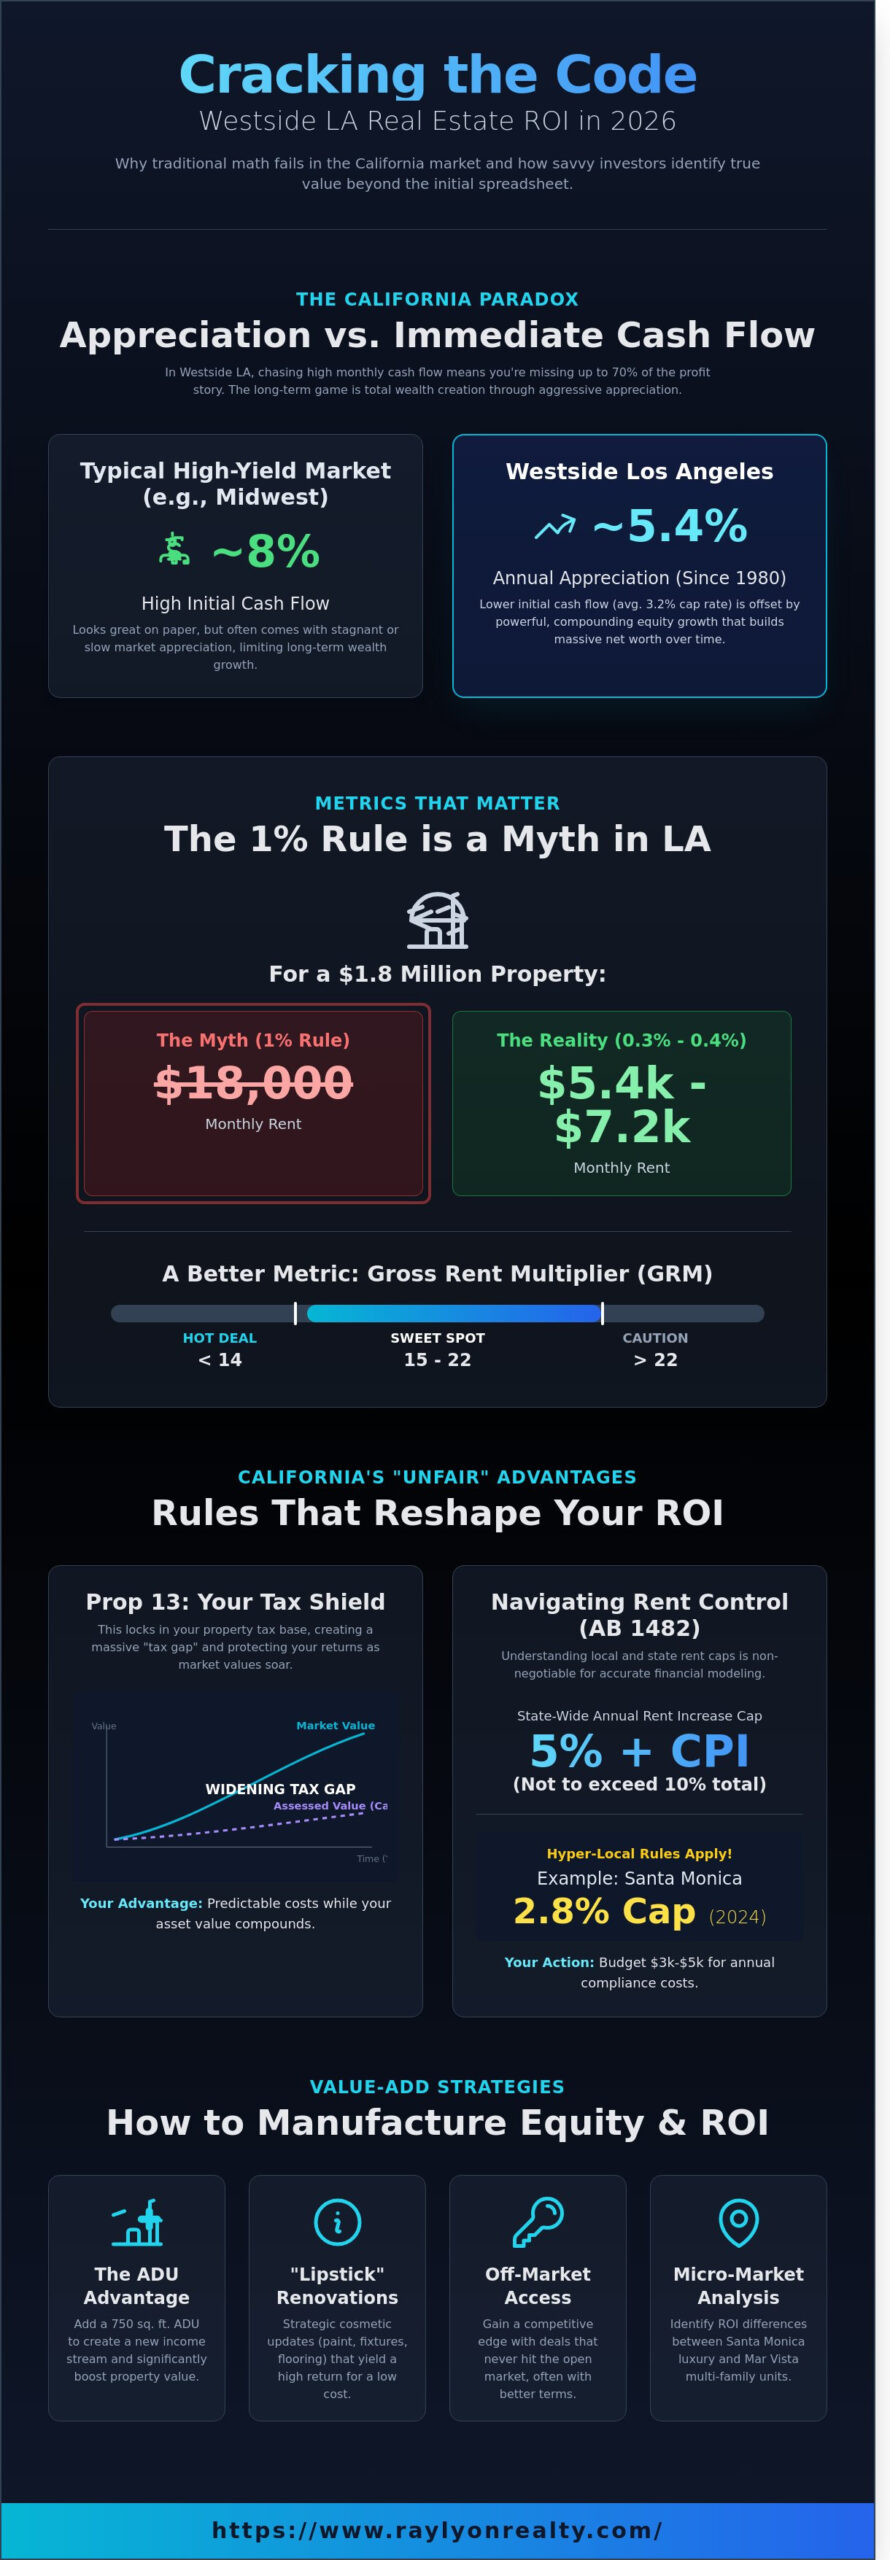
Calculating the true Return on Investment (ROI) in the Golden State requires a different lens than investing in the Midwest or the South. In most markets, cash flow is the only metric that matters. In California, we play a total wealth game. A standard investment property ROI calculator california investors use must account for a mix of aggressive appreciation, specific tax protections, and a complex regulatory environment that dictates your bottom line. If you only look at the monthly check, you’re missing 70% of the profit story.
The “California Paradox” describes why seasoned pros regularly purchase assets with a 3% or 4% cap rate. While an 8% yield in Ohio looks better on paper, the historical data tells a different story. Since 1980, California home prices have appreciated at an average annual rate of roughly 5.4%. Over a ten year hold, that equity growth creates far more net worth than a high-yield rental in a stagnant market. Using a generic online tool often results in a “false negative” on a Westside deal because those calculators don’t factor in the compounding power of coastal land values.
As we look toward the 2026 interest rate environment, your leverage strategy needs to be surgical. Economists project mortgage rates to stabilize between 5.8% and 6.2% by early 2026. This is a far cry from the 3% era of 2021; it means your debt service will be higher. You can’t afford to guess on your vacancy rates or maintenance reserves. You need a tool that treats California as the unique “high-barrier, high-reward” ecosystem it is.
The Prop 13 Factor: Your Secret ROI Weapon
Prop 13 is the most significant advantage for long term owners in California. While property taxes in states like Texas or Florida can spike 15% or 20% in a single year as market values rise, California locks you in. Your base tax is roughly 1.1% of the purchase price, and the assessed value can only increase by a maximum of 2% per year. If you buy a $1.5 million triplex in 2025, your tax bill remains predictable even if the property value doubles by 2035. This creates a widening “tax gap” that protects your internal rate of return (IRR) better than almost any other market in the country.
Regulatory Realities: Rent Control and ROI
You can’t calculate ROI without accounting for the California Tenant Protection Act (AB 1482). This law limits annual rent increases to 5% plus the local Consumer Price Index (CPI), or 10% total, whichever is lower. In 2024, many Los Angeles area landlords saw these caps fluctuate based on shifting inflation data. If you’re looking at Santa Monica, the rules are even tighter; the 2024 General Adjustment was capped at a strict 2.8%. Your investment property ROI calculator california model must include these caps alongside a budget of $3,000 to $5,000 for annual compliance and legal “soft costs.” Ignoring these local mandates will turn a projected profit into a realized loss quickly.
Key Metrics for Your California ROI Calculator
Investing in coastal California requires a different lens than the Midwest or the Sunbelt. When you use an investment property ROI calculator california, you have to prioritize long term wealth over immediate pocket change. In markets like Santa Monica or Mar Vista, the traditional rules of thumb often fall apart. You’re playing a game of appreciation and equity growth, not just monthly checks. Success here depends on mastering a few specific metrics that reflect the reality of Westside LA real estate.
Forget the 1% rule. This old metric suggests a property should rent for 1% of its purchase price monthly. In a neighborhood where a modest bungalow costs $1.8 million, you won’t find a tenant paying $18,000 a month. You’re more likely looking at a rent-to-price ratio of 0.3% to 0.4%. Instead of chasing the 1% myth, savvy investors use the Gross Rent Multiplier (GRM) as a quick filter. For Westside listings, a GRM between 15 and 22 is standard. If you spot a property with a GRM under 14, it’s a signal to move fast, as that represents a rare value in this high demand corridor.
Understanding Capitalization Rate (Cap Rate) in LA
A good Cap Rate in the current Westside LA market typically hovers between 3.5% and 4.5%. While that might look low compared to other states, it reflects the safety and demand of California dirt. Listing agents love to dangle “Pro Forma” Cap Rates in their marketing materials. These numbers are based on “potential” market rents after you spend thousands on renovations. I always tell my clients to ignore those figures and calculate the actual Cap Rate based on the current rent roll.
To find your true Net Operating Income (NOI), you must account for specific local expenses. Don’t forget the 1.25% property tax rate and the City of Los Angeles ULA tax if the transaction exceeds $5.1 million. You should also bake in a 5% vacancy factor and a 7% management fee, even if you plan to manage it yourself. These concrete numbers keep your Westside real estate strategy grounded in reality rather than wishful thinking.
Cash-on-Cash Return vs. Total Return
You might see a low or even slightly negative cash-on-cash return in year one. In many parts of California, this isn’t a deal breaker if the total return is high. Your investment property ROI calculator california should account for the “Tax Shield” provided by depreciation and mortgage interest deductions. These paper losses can often offset your other income, putting more money back in your pocket at tax time than the monthly rent ever could.
The real magic happens with appreciation. According to 2026 housing market predictions, tight inventory levels in coastal hubs are expected to support steady price growth. If you factor a conservative 4.5% annual appreciation into a 10 year model, a $2 million property adds $90,000 to your net worth in the first year alone. That dwarfs a few hundred dollars of monthly cash flow. When you look at the Equity Multiple over a decade, the California market consistently outperforms high cash flow markets that lack price growth.
Finally, consider your cost of capital. In the 2026 financing environment, interest rates are expected to stabilize around 5.5% to 6.2%. This makes leverage a powerful tool, but it also means your margins are thinner. You need a calculator that accounts for these specific debt service costs against the rising rents we see in rent controlled areas like Santa Monica, where the annual allowable increase often trails behind inflation.
Calculating ROI Across Westside LA Micro-Markets
Westside Los Angeles isn’t a single market; it’s a collection of blocks where the math changes instantly. In Mar Vista, a property on the north side of Venice Boulevard often commands $450 more in monthly rent than a similar home just three blocks south. This happens because of specific elementary school boundaries and proximity to retail hubs. To get an accurate reading from an investment property ROI calculator California, you need this granular data. Comparing a Santa Monica condo to a Venice multi-family unit is like comparing apples to oranges. One offers steady appreciation while the other provides the raw cash flow needed to scale a portfolio.
The ‘Culver City Effect’ is a real phenomenon that savvy investors track closely. Since 2019, tech giants like Amazon and Apple have occupied over 550,000 square feet of office space in the area. This influx of high-earning professionals has pushed vacancy rates in the surrounding 2-mile radius down to a tight 2.8%. When you’re calculating your potential returns, you can confidently adjust your vacancy loss assumptions downward. Most standard models use 5%, but the high demand near these tech hubs allows for a more aggressive 3% estimate in your financial projections.
Santa Monica: High Barrier, High Stability
Investing within 1.5 miles of the Pacific Ocean offers unmatched stability but requires a specific budget for upkeep. Salt air corrosion increases exterior maintenance costs by roughly 18% compared to inland properties. Additionally, Santa Monica’s strict 30-day minimum for short-term rentals means you must calculate your gross income based on long-term leases rather than nightly rates. Expect a steady 3.2% to 4.1% cap rate in this high-demand zone.
Mar Vista and Venice: The Value-Add Sweet Spots
These neighborhoods are the heart of Silicon Beach, where workers from Google’s Spruce Goose office seek modern aesthetics. You’ll find the best upside by “putting lipstick” on 1950s bungalows. A $65,000 cosmetic renovation in Mar Vista can often trigger a $1,300 monthly rent increase. Using an investment property ROI calculator California helps you see how these forced appreciation moves dramatically shorten your break-even period on the initial capital investment.
If you want a better Gross Rent Multiplier (GRM), look at emerging pockets like Del Rey or the southern edge of Palms. In these zones, GRMs often sit around 14 or 15. In contrast, prime Santa Monica frequently hits 22 or higher. A lower GRM means you are paying less for every dollar of gross rent produced. For instance, a $1.4 million duplex in Del Rey might bring in $8,800 a month. That same $1.4 million in a prime coastal location might only get you a small condo with $800 monthly HOA fees and a $4,800 rental ceiling. Finding these off-market deals in emerging areas is how we help our clients beat the average market returns.
- Mar Vista: High demand for 3-bedroom units from young families.
- Venice: Multi-family units offer better cash-on-cash returns than single-family homes.
- Del Rey: Favorable GRM for investors looking to enter the Westside under $1.5 million.
- Culver City Border: Lowest vacancy rates due to the 2024 expansion of tech campus footprints.
Strategies to Boost Your California Property ROI
Once you’ve run the numbers through our investment property ROI calculator california, you’ll have a clear baseline for your potential returns. But high-performing investors don’t just accept the market average. They look for specific “value-add” levers to pull. In California’s 2024 market, the gap between a 4% cap rate and a 7% cap rate often comes down to how well you utilize local zoning changes and tax deferral strategies. You can’t control interest rates, but you can control your property’s density and efficiency.
The ADU (Accessory Dwelling Unit) ROI Math
The math behind an ADU is hard to beat. In Los Angeles or San Diego, construction costs for a detached ADU typically range from $275 to $425 per square foot. While that sounds high, the market rent for these units often hits $4.50 to $6.00 per square foot. This creates a yield on cost that far exceeds the main house. California’s SB 9 and SB 10 laws have essentially unlocked the “density play” for every residential lot. You can now turn a single-family home into a multi-unit income stream without a lengthy rezoning process. Appraisals for properties with permitted ADUs in 2024 are showing a 20% to 30% increase in total value compared to standard homes.
Strategic renovations are about more than just aesthetics. We call it putting “lipstick” on a property, but you have to be smart about where the money goes. In high-demand markets like Santa Monica or West Hollywood, a $15,000 kitchen cosmetic refresh-new hardware, quartz counters, and painted cabinets-can trigger a $350 monthly rent increase. That’s a 28% annual return on that specific investment. If you’re looking at a larger portfolio move, don’t forget the 1031 exchange. This allows you to sell a lower-performing asset and “trade up” into a higher-yield property while deferring the 20% federal capital gains tax and California’s 13.3% state tax rate. This keeps your capital working for you instead of going to the IRS.
Lowering your operating expenses is the fastest way to boost your bottom line. California offers some of the most aggressive energy rebates in the country. The TECH Clean California program currently provides up to $3,000 for heat pump water heater installations. These upgrades don’t just lower the bills; they appeal to the modern, eco-conscious California tenant who is willing to pay a premium for a “green” home. Every dollar you save on utilities or maintenance directly increases your Net Operating Income (NOI).
Operational Efficiency: Cutting the Fat
Managing a property yourself might seem like a way to save 8%, but it often costs you more in the long run. Professional management teams in California typically maintain vacancy rates below 3.5%, whereas self-managed properties often hover around 7% or 8%. Another massive ROI booster is the Ratio Utility Billing System (RUBS). This allows you to pass water, trash, and sewage costs back to the tenants based on occupancy. On a four-plex, this can shift $5,000 in annual expenses from your ledger to the tenants. Finally, stick to a strict preventative maintenance schedule. Spending $400 on a seasonal HVAC tune-up prevents a $12,000 emergency replacement during a July heatwave.
Ready to find a property that beats the averages? Search our latest California listings to find your next high-yield investment opportunity.
The Ray Lyon Realty Advantage: Beyond the Spreadsheet
A spreadsheet gives you the map, but it doesn’t drive the car. While our investment property ROI calculator california provides the essential math, successful investing in the Golden State requires local intuition and aggressive networking. I don’t just analyze these deals from a distance; I live them. My personal LA investment portfolio consists of multi-family units and value-add flips where I’ve personally managed everything from foundation repairs to tenant placements. This hands-on experience means I’ve already made the mistakes so you don’t have to. We look past the raw numbers to see the potential that a standard algorithm might miss.
In a market as competitive as Los Angeles or the Westside, the best deals rarely make it to the MLS. By the time a property hits widely publicized real estate platforms, the bidding war has often already eroded the potential return. We focus on off-market opportunities and pocket listings. These “quiet” deals allow our clients to secure properties without the frantic overbidding that kills cash flow. Finding “true” ROI means getting in early, often through direct relationships with owners who prefer a discreet, professional sale over a public circus.
We also give our clients a distinct edge through our “lipstick” renovation strategy. We maintain a vetted network of 14 local contractors who understand the balance between cost and impact. We focus on high-ROI cosmetic upgrades like modern flooring, recessed lighting, and drought-tolerant landscaping. These specific improvements allow our clients to demand top-dollar rents or achieve a higher appraisal for a cash-out refinance. In April 2024, one of our clients used this exact strategy to increase their monthly rental income by 22% within just 45 days of closing.
Finding the Hidden Gems
We specialize in identifying properties with “deferred maintenance” that scare off the average buyer. These are the real winners. Our team uses deep block-to-block knowledge to predict which pockets of a neighborhood are about to see a surge in appreciation. We don’t just look at the house; we look at the new coffee shop opening two blocks away or the city’s 2025 transit plans. This granular data ensures you’re buying into growth, not just buying a building.
Your Partner in Long-Term Wealth Building
Investing is a marathon, not a sprint. We manage the entire lifecycle of your investment, from the initial acquisition using an investment property ROI calculator california to the eventual 1031 exchange into a larger asset. We provide the patience and strategy needed to build a legacy. We treat your capital with the same respect I treat my own, prioritizing data over emotion every time. It’s about building wealth that lasts for generations.
Ready to move beyond the numbers and start building your portfolio? Schedule an Investment Strategy Session with Ray Lyon.
Case Study: Outperforming the Westside Market
In February 2024, we facilitated a transaction for a duplex in Mar Vista that perfectly illustrates the Ray Lyon advantage. While the average market ROI was hovering around 4.5%, we secured an off-market deal for $1.35 million. The property required $72,000 in targeted “lipstick” renovations. After 60 days of work, the property was reappraised at $1.68 million. This move generated over $250,000 in immediate equity and secured a 6.8% cash-on-cash return, significantly outperforming the local neighborhood average for that quarter.
Secure Your Westside Advantage for 2026
Success in the California market requires more than a standard spreadsheet. You’ve learned that micro-market fluctuations between Santa Monica and Mar Vista can swing your net yield by significant margins. While an investment property ROI calculator california provides a necessary baseline, it’s the nuanced data like 1031 exchange timelines and trust sale complexities that protect your capital. I’ve personally flipped properties and managed my own rentals, so I know that block to block knowledge is what actually drives a 10% increase in your final return.
Don’t leave your 2026 portfolio growth to guesswork. My team provides the strategic insight I use for my own investments, from identifying off-market gems to navigating specific appraisal contingencies. Whether you’re looking to defer taxes through a 1031 exchange or find high-upside potential, we have the local expertise to make it happen. It’s time to move beyond the screen and start building real wealth. We’re ready to help you navigate the complexities of the Westside market with confidence and precision.
Run your numbers with a Westside LA investment expert; contact Ray Lyon today
Your next great investment is just one conversation away. Let’s get to work.
Frequently Asked Questions
What is considered a good ROI for a rental property in California in 2026?
You should aim for a 5% to 8% capitalization rate for stabilized assets in 2026. While coastal markets like Santa Monica often see lower yields around 3.5%, inland areas like Riverside can hit 7% or higher. Total ROI, including appreciation and principal paydown, should target 10% to 12% annually. Don’t forget that California’s historical 5.4% annual appreciation rate since 1980 often does the heavy lifting for your long-term wealth.
How does Prop 13 affect my investment property’s ROI over time?
Prop 13 boosts your long-term ROI by capping property tax increases at 2% per year regardless of market value spikes. This creates a widening gap between your fixed costs and rising market rents. If you bought a $1,000,000 duplex today, your base tax stays predictable even if the property value doubles in ten years. This stability protects your cash flow from the volatility seen in states without such tax protections.
Can I still find cash-flow positive properties in Westside Los Angeles?
You can find cash-flow positive properties in Westside LA if you put down at least 35% or target value-add opportunities with deferred maintenance. In 2024, the average cap rate in West LA hovered around 3.8%. To make the numbers work on an investment property ROI calculator California investors use, you often need to look for properties with ADU potential or those that are currently under-rented by 20% or more.
Is it better to invest in a condo or a single-family home for the best ROI?
Single-family homes generally provide a 15% to 20% higher total ROI over a ten-year hold due to faster appreciation and the absence of high HOA fees. While condos offer lower entry prices, monthly HOA dues often eat up 25% of your gross rental income. California Association of Realtors data shows that detached homes have appreciated at nearly double the rate of condos in suburban markets over the last five years.
How do ADUs impact the ROI of a California residential property?
Adding an Accessory Dwelling Unit (ADU) can increase your property’s total ROI by 2% to 4% by providing a secondary stream of high-margin rental income. A 600-square-foot ADU costing $200,000 can generate $2,500 in monthly rent, representing a 15% cash-on-cash return on that specific capital expenditure. It’s one of the most effective ways to turn a cash-flow neutral property into a profitable one without buying more land.
What are the biggest ‘hidden’ expenses in a California ROI calculation?
The biggest hidden expenses include the 0.5% to 1% annual maintenance reserve and city-specific gross receipts taxes which cost $1.27 per $1,000 of income in Los Angeles. Many investors also forget to budget for a 5% vacancy factor or the $800 annual LLC franchise tax required for holding California property. Using an investment property ROI calculator California helps you account for these specific line items so your net profit isn’t a surprise.
Should I use a 1031 exchange to improve my real estate ROI?
You should use a 1031 exchange if you want to defer the 15% to 20% federal capital gains tax and the 13.3% California state tax on your profits. By rolling 100% of your equity into a larger or higher-yielding property, you keep your entire investment working for you. This tax-deferred growth can compound your wealth significantly faster than selling, paying taxes, and reinvesting the remaining 70% of your gains.
How do California’s rent control laws impact my long-term profit projections?
Assembly Bill 1482 limits annual rent increases to 5% plus the local CPI, which currently caps most increases at 10% total. This creates a predictable ceiling for your income growth that you must factor into your 10-year projections. While it limits windfall rent spikes, it also stabilizes your tenant base and reduces turnover costs. Properties built within the last 15 years are generally exempt, allowing for market-rate adjustments until they hit that age threshold.